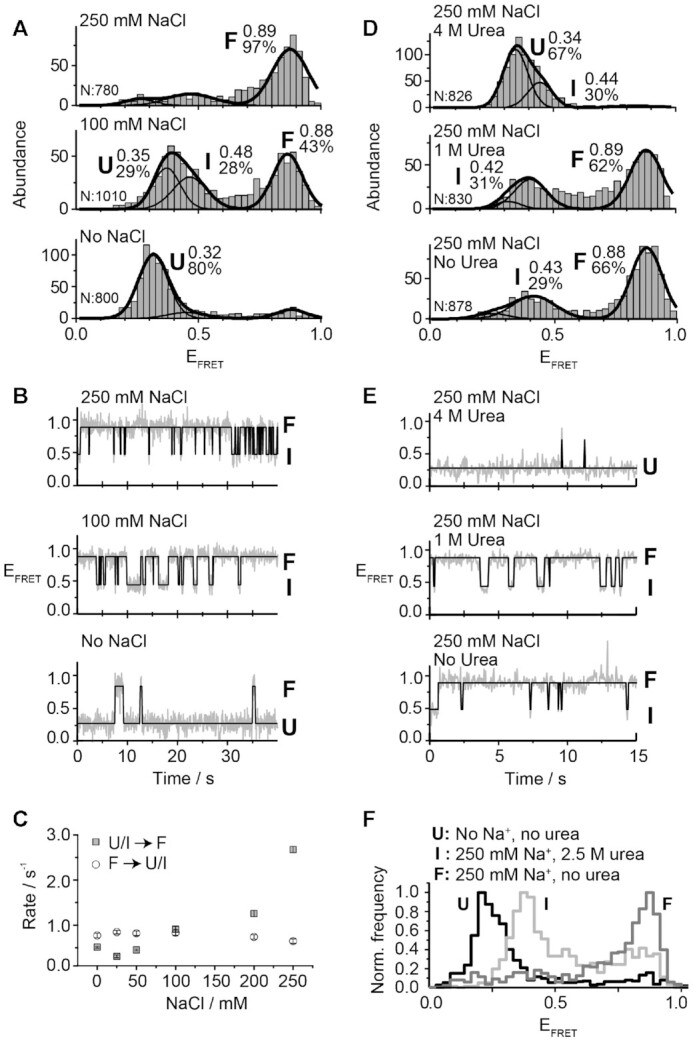
Figure 3.

smFRET analysis for the vector P2–P3 as a function of NaCl and urea. (A, B) smFRET histograms (A) and time traces (B) experiments performed for the wild-type aptamer as a function of NaCl concentration. The NaCl concentration used in each experiment is indicated above each graph. The number of analyzed molecules (N) and the proportion of each analyzed population are indicated. (C) Effect of NaCl on the transition rates for the folding process from U/I to F states (grey squares) and for the unfolding process from F to U/I states (empty circles). (D, E) smFRET histograms (D) and time traces (E) experiments performed for the wild-type aptamer in 250 mM NaCl as a function of urea concentrations. The urea concentration used in each experiment is indicated above each graph. EFRET values determined by fitting analysis to a Gaussian distribution for each population are indicated. The solid line represents the three-state trajectory obtained from a hidden Markov modeling of the experimental trace. (F) Normalized single-molecule FRET histograms obtained with no NaCl added (dark grey, U state), in a background of 250 mM NaCl and 2.5 M urea (light grey, I state) and with 250 mM NaCl and no urea (grey, F state).
