
Figure 7.
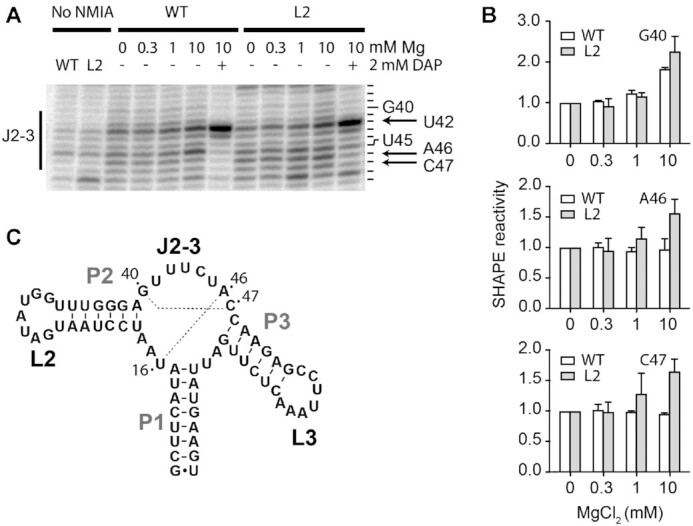
SHAPE analysis of the adenine aptamer. (A) SHAPE experiments performed for the wild-type (WT) and the L2 mutant (L2) aptamers. Reactions were done using various concentrations of magnesium ions (0, 0.3, 1 and 10 mM) in the absence or presence of 2 mM DAP. Control experiments were performed for both the wild type and the L2 mutant in which the NMIA reagent was replaced with DMSO. Only the region J2–3 of the aptamer is shown. The reacting nucleotides are shown on the right of the gel and the arrow shows position A46. The complete gel is shown in the Supplementary Figure S11. (B) Quantification of SHAPE data obtained at various magnesium ions concentrations for positions G40, A46 and C47. The average and the standard errors are shown. (C) Secondary structure and sequence of the add aptamer showing the presence of Watson-Crick base pairs occurring within the core domain of the aptamer (dotted lines).