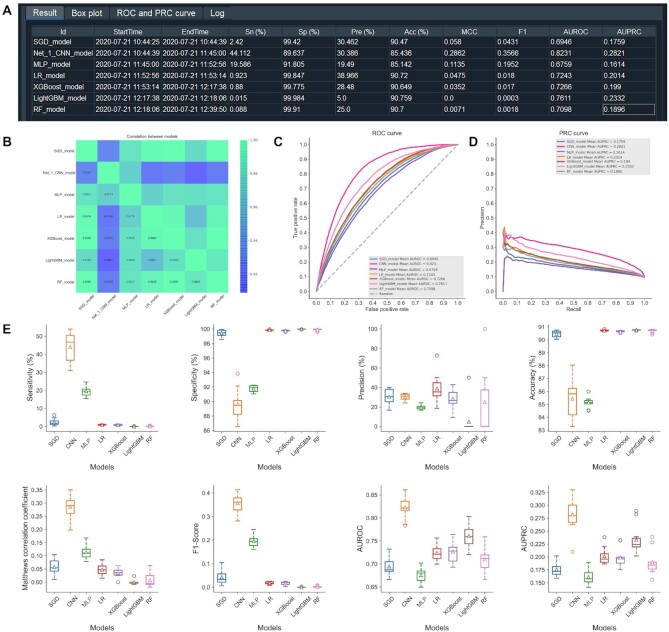
Figure 9.
An illustration of the prediction results generated by different machine-learning algorithms using the iLearnPlus-AutoML module for identification of protein crotonylation sites, including the evaluation metrics showing the predictive performance in terms of eight evaluation metrics (A), the correlation matrix of seven selected classifiers (B), ROC curves (C), PRC curves (D) and the boxplots (E) of eight metrics for comparative performance assessment of all the seven selected machine-learning algorithms.

