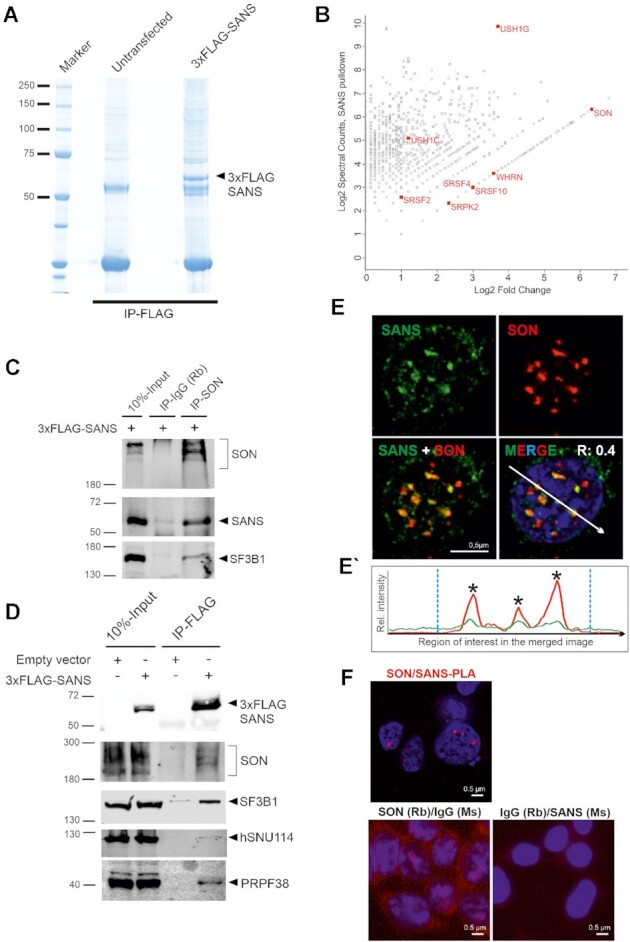
Figure 3.

Affinity proteomics and validation of SANS interactions in the nucleus. (A) Coomassie blue staining of anti-FLAG immunoprecipitated proteins from nuclear extracts of control cells and cells expressing 3xFLAG-SANS, loaded onto a 4–12% NuPAGE. (B) Proteomic analysis of SANS interaction partners. Graph displays the relative abundance, in logarithmic scale, of proteins identified in 3xFLAG-SANS pull-down from nuclear extract compared with the control. Each dot represents a protein; SR-related splicing factor SON, SR splicing proteins and the SR protein kinase SRPK2 as well as the identified USH proteins are highlighted in red. (C) Validation of SON-SF3B1-SANS interactions by IP of intrinsic SON in cells expressing 3xFLAG-SANS. SON interacts with SANS and SF3B1. (D) Western blot analysis of anti-FLAG immunoprecipitations from control and 3xFLAG-SANS nuclear extracts revealed SANS interactions with SON, SF3B1, hSNU114, and PRPF38. (E) Double immunofluorescence staining of endogenous SANS (MmAb) and SON in HEK293T cells counterstained with DAPI for DNA. Positive Pearson′s correlation coefficient (R) supports co-localization of SANS and SON. (E′) Fluorescence intensity plots for the region of interest in D (white arrow) shows co-localization of SANS with SON in the nucleus. Blue vertical dashed lines indicate the boundaries of the nucleus. (F) PLAs demonstrate interaction of SANS with SON in cells. Red PLA signals are present in the nucleoplasm in SANS-SON PLAs but absent in the negative controls anti-SANS (MmAb) or rabbit anti-SON with mouse and rabbit IgG antibodies.
