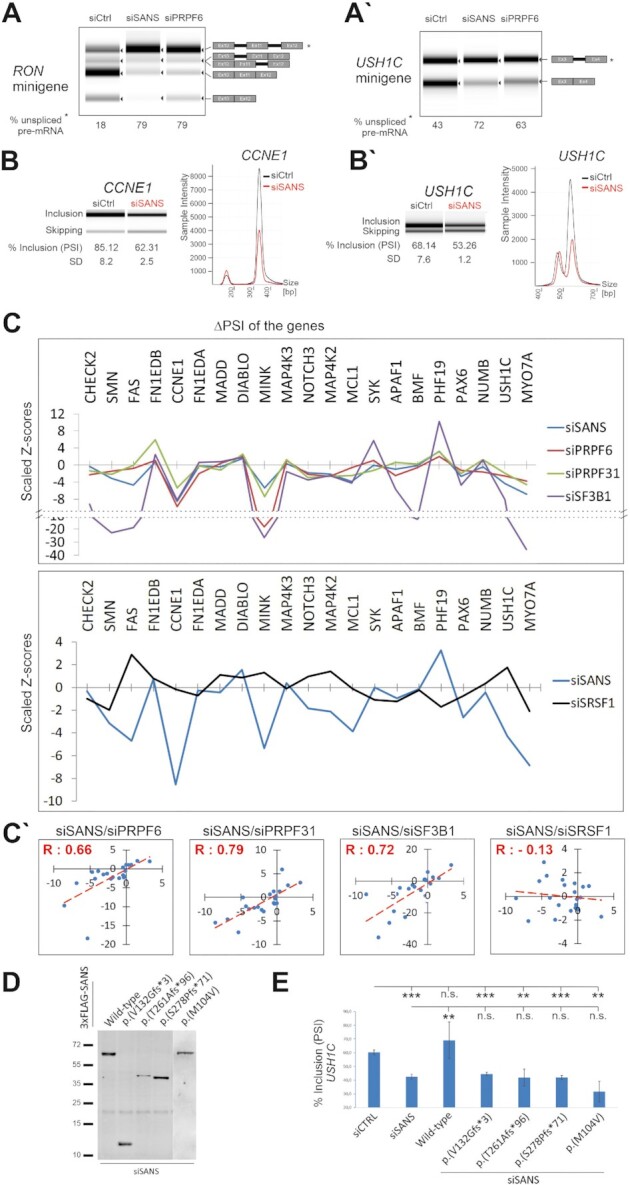
Figure 7.

SANS regulates in vitro splicing of minigene reporters as well as splicing of genes related to cell proliferation and the human Usher syndrome. (A–A′) Splicing of RON and USH1C minigenes in SANS- and PRPF6-depleted cells. Percentage of unspliced mRNA is indicated below lanes. (B–B′) High throughput capillary electrophoresis analyses of alternatively spliced variants of the CCNE1 gene (exon 9) and USH1C (exon 11) gene after siRNA-mediated depletion of SANS. Relative intensities of the exon included and skipped isoforms obtained from the representative gel images are shown. PSI (% inclusion) and SD indicate, respectively, the percentage spliced-in median and the standard deviation values from three independent experiments. (C) Graphs showing the splicing perturbation profiles of selected endogenous genes upon knockdown of PRPF6, PRPF31, SF3B1 (upper panel), SRSF1 (lower panel) or SANS. Scaled Z-scores represent changes toward inclusion (>0) or skipping (<0) for each alternative splicing event after siRNA mediated knockdowns. SANS depletion exhibits very similar perturbation profiles to PRPF6, PRPF31, and SF3B1 knockdowns (upper panel), but to SRSF1 (lower panel). (C′) Quantile-quantile (Q-Q) plots are showing positive correlation between SANS, PRPF6, PRPF31 and SF3B1 (Pearson′s correlation coefficient values indicated with positive R values) but not with SRSF1 (negative R value). (D) Western blot analysis showing the expression of SANS pathogenic variants in the SANS-depleted cells. (E) Capillary electrophoresis analyses of alternatively spliced variants of USH1C (exon 11) gene after siRNA-mediated depletion of SANS following by overexpression of the wild-type and pathogenic USH1G variants. Only wild-type SANS, but none of the pathogenic USH1G variants restored the siSANS-induced splicing deficiency in USH1C. Relative intensities of the exon included and skipped isoforms obtained from the representative gel images are shown. Quantification of PSI (% inclusion) and SD values shows the percentage spliced-in median and the standard deviation values from three independent experiments. ***P values < 0.001, *P values < 0.05.
