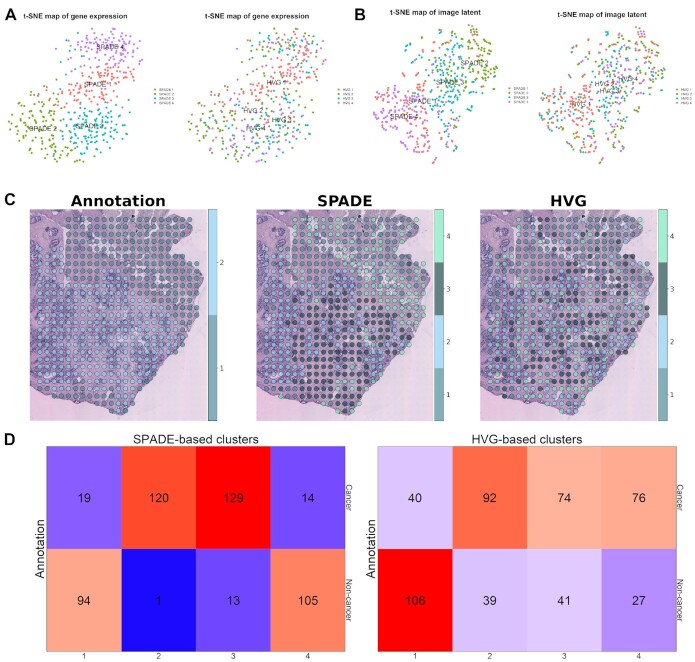
Figure 4.
Spot clustering based on SPADE genes in prostate cancer (P3.3) data. (A) t-SNE plots of transcriptomic data from prostate cancer tissue. Both of the plots were generated based on transcriptomic profiles of SPADE genes. SPADE and HVG-based cluster identity is visualized in the left and right panel, respectively. (B) t-SNE plots for deep learning-derived image features from prostate cancer data. SPADE and HVG-based cluster identity is visualized in the left and right panel, respectively. (C) Spatial distribution of pathologic annotation and clusters based on SPADE genes or HVGs are mapped to the tissue slide. For the pathologic annotation, spot 1 stands for cancer and spot 2 for non-cancer tissues. (D) Cross tables exhibiting the number of overlapping spots between SPADE or HVG-based cluster and pathologic annotation are presented in the left and right panel, respectively. The top row in the cross table shows the spot numbers corresponding to cancer tissue and the bottom row for non-cancer tissue.

