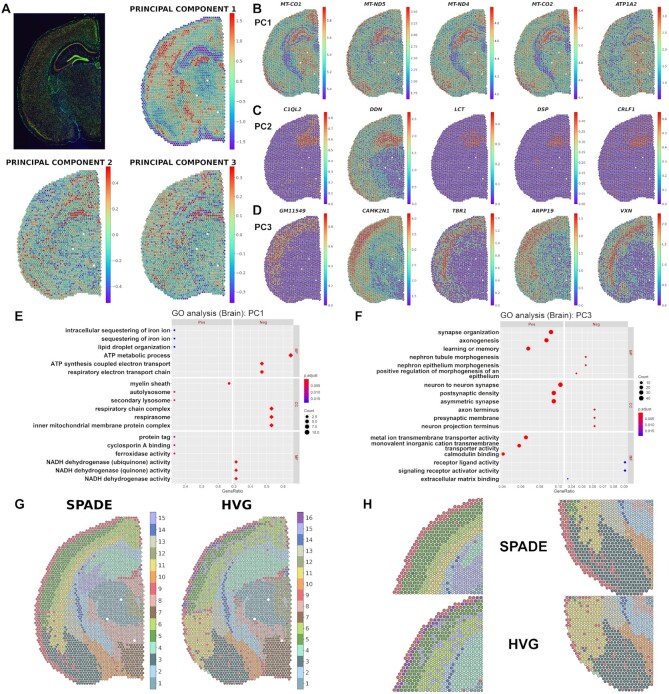
Figure 5.
Application of SPADE in immunofluorescence stain of mouse brain. (A) Spatial mapping of the PC1, PC2 and PC3 image latents. The PC values in each spot are visualized using colormaps. The maximum and minimum values of the colormap represent two standard deviations above and below the mean value, respectively. Spatial mapping of the top 5 genes showing the greatest contrast in (B) PC1, (C) PC2 and (D) PC3 image latent space. The top genes are presented in descending order of |log2RC| (FDR < 0.05). The normalized gene expression level in each spot is visualized using a colormap. The maximum and minimum values of the colormap represent two standard deviations above and below the mean expression, respectively. Gene ontology (GO) analysis for (E) PC1 and (F) PC3 SPADE genes showing positive or negative association with PC image latent in mouse brain data. The top 3 positive or negative GO terms for each subcategory, biological process (BP), cellular component (CC) and molecular function (MF), are exhibited in the left and right panel, respectively. The number of overlapping genes is expressed as the size of the dot, and the Benjamini-Hochberg adjusted P-value is exhibited with a colormap. (G) Spatial distribution of SPADE and HVG-based spot clusters mapped to the mouse brain tissue. The background immunofluorescence image was removed such that the colors of each cluster are more clearly visualized. The cluster numbers for the SPADE or HVG-based cluster are exhibited in the right panel. (H) Enlarged images showing the spatial distribution of SPADE and HVG-based clusters in cortical layers (left panel) and amygdala (right panel). The images for the SPADE and HVG-based clusters are exhibited in the top and bottom panel, respectively.

