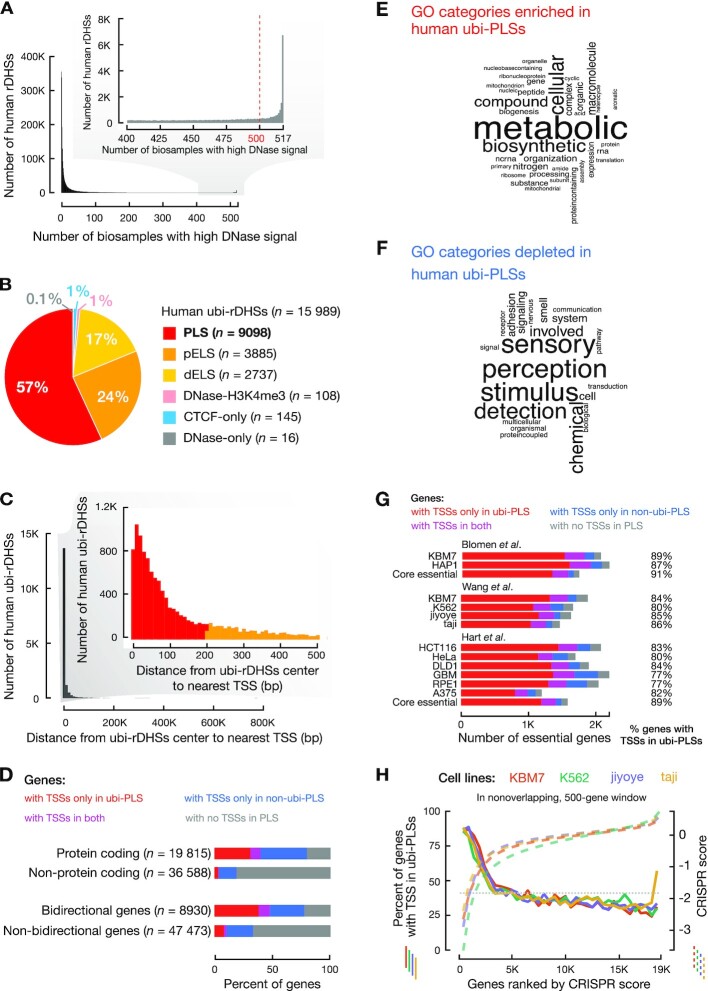
Figure 1.
The majority of ubiquitously DNase-accessible regions are active promoters of essential genes. (A) Definition of ubi-rDHSs. The histogram shows the number of human rDHSs that have high DNase signals in different numbers of biosamples. rDHSs that have high DNase signals in 500 or more human biosamples (out of a total of 517 biosamples) are defined as ubi-rDHSs. (B) The majority of human ubi-rDHSs have promoter-like signatures or are TSS-proximal with enhancer-like signatures. The pie chart shows the category of ubi-rDHSs: PLS, rDHSs with promoter-like signature; pELS, TSS-proximal enhancer-like signature; dELS, TSS-distal enhancer-like signature; DNase-H3K4me3, TSS-distal rDHSs with high DNase and high H3K4me3 signals but low H3K27ac signals; CTCF-only, rDHSs with high DNase and high CTCF signals but low H3K4me3 and H3K27ac signals; DNase-only, rDHSs with high DNase signals but low H3K4me3, H3K27ac and CTCF signals. (C) The majority of ubi-rDHSs are near a TSS. The histogram shows the number of ubi-rDHSs at a certain distance from the nearest GENCODE-annotated TSS. (D) Higher percentages of protein-coding genes and bidirectional genes have TSSs overlapping ubi-PLSs than other types of genes. Genes with TSSs only overlapping ubi-PLSs are shown in red; genes with TSSs only overlapping non-ubi-PLSs are in blue; genes with TSSs overlapping both ubi-PLSs and non-ubi-PLSs are in purple; and genes with no TSSs overlapping cCRE-PLSs are in gray. (E) Word cloud of the most enriched GO Biological Process terms for genes with TSSs overlapping ubi-PLSs. (F) Word cloud of the most depleted GO Biological Process terms for genes with TSSs overlapping ubi-PLSs. (G) A high percentage of cell-essential genes have TSSs overlapping ubi-PLSs. Three groups of bar plots represent cell-essential genes from three different studies, while core essential genes overlap essential genes between different cell lines defined in the studies. Classification of genes in this figure are the same as in Figure 1D. (H) The TSSs of most top-ranked cell-essential genes are located in ubi-PLSs. Four solid lines show the percentage of cell-essential genes with TSSs overlapping ubi-PLSs, plotted for nonoverlapping, 500-gene windows in four cell lines (y-axis on the left, solid lines) as functions of the ranks of the genes according to their CRISPR scores. Cell-essential genes from Wang et al. CRISPR scores (y-axis on the right, dashed lines) are also shown as functions of the ranks of these scores. The horizontal dotted line shows the percentage of all tested genes with TSSs overlapping ubi-PLSs.

