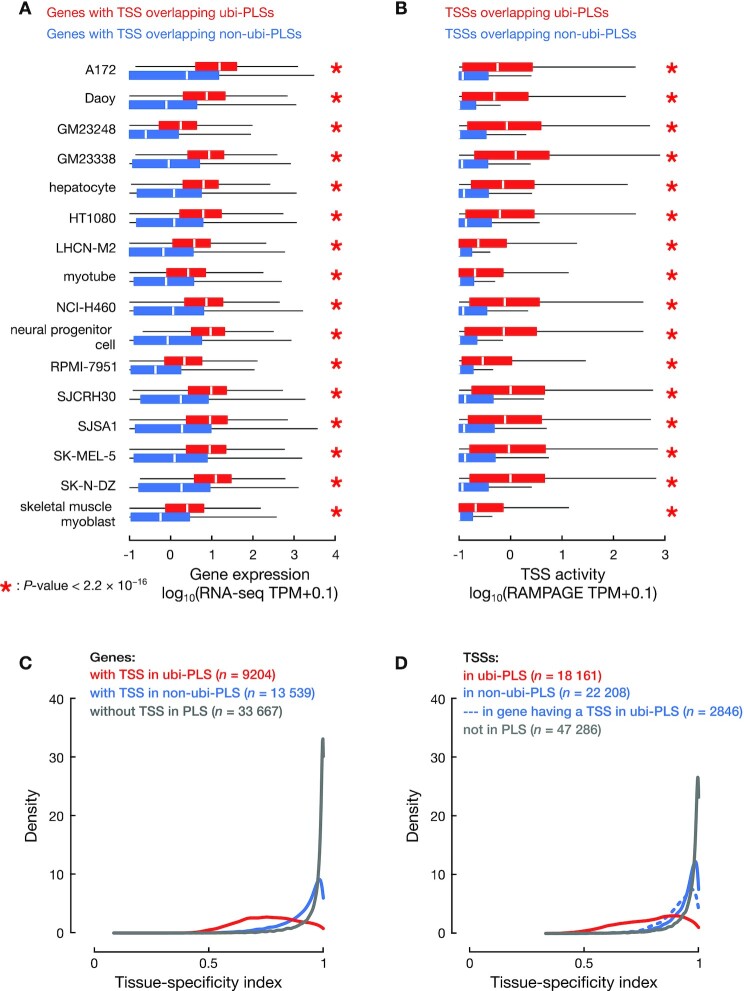
Figure 3.
ubi-PLSs are promoters of ubiquitously expressed genes. (A) Genes whose TSSs overlapped ubi-PLSs (red) are significantly more highly expressed than genes whose TSSs overlapped non-ubi-PLSs (blue) in the same biosample. Expression levels were obtained from RNA-seq data, quantified by TPM (with a pseudocount of 0.1 added to each gene), and plotted in log scale. All P-values were computed with Wilcoxon rank-sum tests. (B) TSSs overlapping ubi-PLSs (red) are significantly more active than TSSs overlapping non-ubi-PLSs (blue) in the same biosample. TSS activities were computed using RAMPAGE data, quantified by TPM (with a pseudocount of 0.1 added to each TSS), and plotted in log scale. All P-values were computed with Wilcoxon rank-sum tests. (C) Distributions of the tissue-specificity index for genes whose TSSs overlap ubi-PLSs (red), overlap non-ubi-PLS (blue), and do not overlap a cCRE-PLS (gray). The tissue-specificity index was computed using RNA-seq data across 103 human biosamples (see Materials and Methods). The three distributions are significantly different (Wilcoxon rank-sum test P-values < 2.2 × 10⁻¹⁶ for ubi-PLS versus non-ubi-PLS or versus non-PLS). (D) Distributions of the tissue-specificity index for TSSs overlapping ubi-PLSs (red), TSSs of the genes without a ubi-PLS overlapping TSS but with at least one TSS overlapping a non-ubi-PLS (solid blue), other TSSs of the genes with at least one TSS overlapping a ubi-PLS (dashed blue), and TSSs not overlapping a cCRE-PLS (gray). All the distributions are significantly different (Wilcoxon rank-sum test P-values < 2.2 × 10⁻¹⁶ for TSSs overlapping ubi-PLS versus each of the other three groups of TSSs).

