Figure 4.
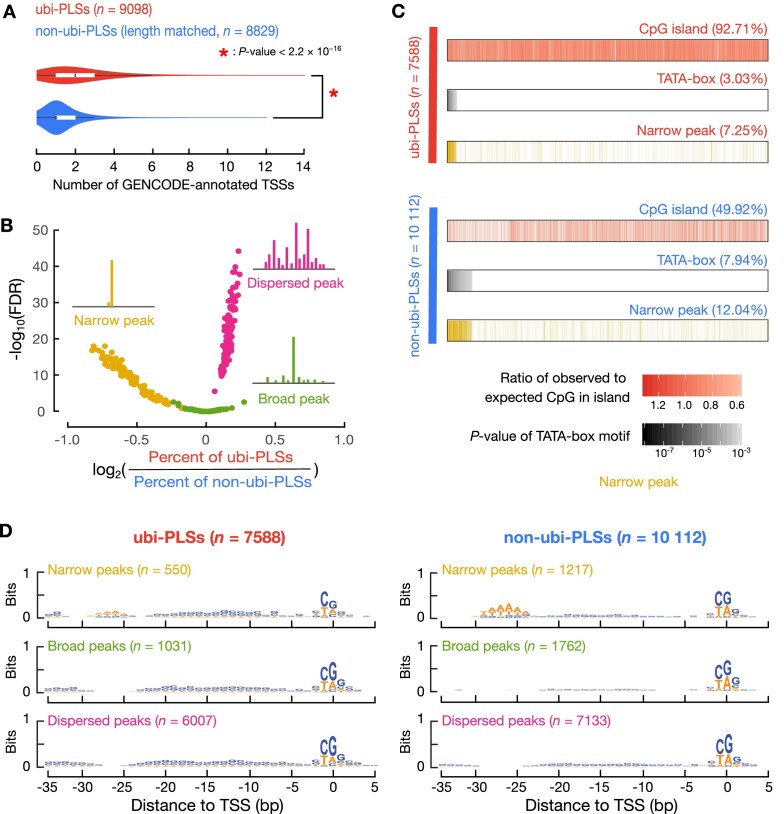
The promoter features of ubi-PLSs. (A) ubi-PLSs (red) tend to have multiple GENCODE-annotated TSSs while non-ubi-PLSs (blue) normally contain one TSS. A subset of non-ubi-PLSs were used to match the length distribution of ubi-PLSs. The P-value was computed with a Wilcoxon rank-sum test. (B) ubi-PLSs are enriched in dispersed peaks, while non-ubi-PLSs are enriched in narrow peaks. The three types of promoter peak shape (narrow, broad, dispersed) were defined using RAMPAGE data in 115 biosamples (see Materials and Methods). For each type of promoter peak shape, we generated a volcano plot with the x-axis showing the log2(fold change) of the percentage of ubi-PLSs over the percentage of non-ubi-PLSs assigned to a peak shape in a RAMPAGE dataset, and the y-axis showing the significance of the enrichment in that peak shape (-log10 of the Fisher's exact test P-values after FDR correction). We overlaid all three volcano plots for comparison (one yellow, one red, and one green, plotting the enrichment for narrow, dispersed, and broad peaks, respectively). (C) ubi-PLSs are more likely to overlap CpG islands and less likely to have TATA-boxes than non-ubi-PLSs. Two groups of bars with columns depict ubi-PLSs and non-ubi-PLSs, respectively. The top bar in each group shows the enrichment of CpG islands, the middle bar shows the enrichment of TATA-boxes, and the bottom bar shows whether a cCRE-PLS is a narrow peak. The ubi-PLSs and non-ubi-PLSs (individual columns in each bar) are sorted from left to right by the –log10(P-value of the TATA-box motif). (D) Sequence logos of ubi-PLSs and non-ubi-PLSs with narrow, broad, and dispersed peaks, respectively.

