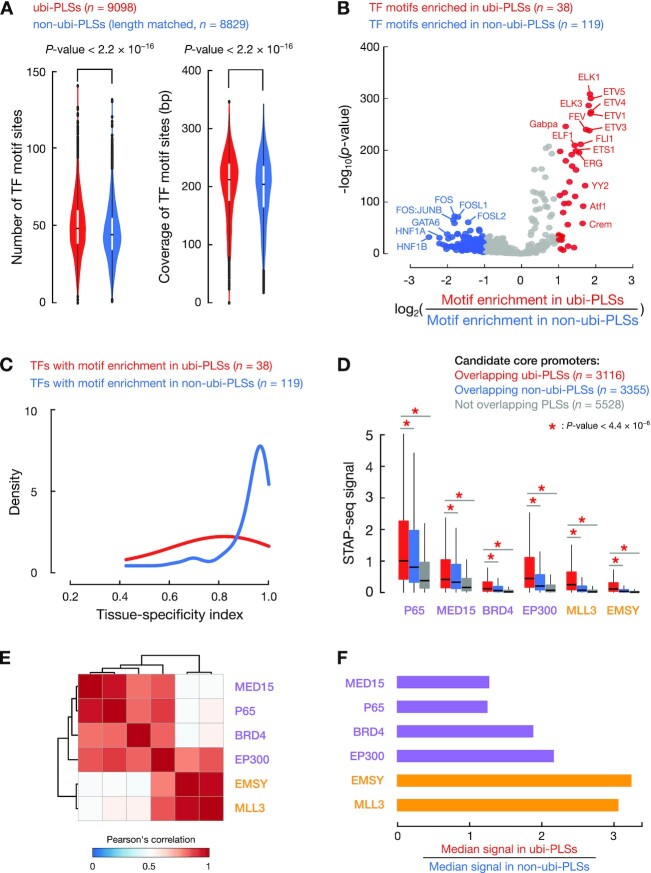
Figure 5.
ubi-PLSs have more transcription factor binding sites than non-ubi-PLSs, and the two sets of cCRE-PLSs are enriched in different transcription factor motifs. (A) Violin plots compared the number of transcription factor binding sites (left) and the total number of genomic positions covered by transcription factor binding sites (coverage, right) between ubi-PLSs (red) and non-ubi-PLSs (blue). Non-ubi-PLSs were downsampled to match the length distribution of ubi-PLSs for a fair comparison. All P-values were computed with Wilcoxon rank-sum tests. (B) The volcano plot shows the enriched transcription factor motifs for ubi-PLSs versus non-ubi-PLSs. Each dot represents a transcription factor motif. The x-axis shows the log2(fold change) of the transcription factor motif enrichment in ubi-PLSs over non-ubi-PLSs, and the y-axis depicts Fisher's exact test P-value of the enrichment. Transcription factors whose motifs are enriched in ubi-PLSs are in red, while transcription factors whose motifs are enriched in non-ubi-PLSs are in blue. (C) Transcription factors that prefer to bind ubi-PLSs are less tissue-specific than the transcription factors that prefer to bind non-ubi-PLSs. The two groups of transcription factors are defined by their enriched motifs in panel B, and the tissue-specificity index was calculated using RNA-seq data across 103 samples as in Figure 3C. TF: transcription factor. (D) Boxplots show the activities (STAP-seq signals) of the candidate core promoters that overlapped ubi-PLSs (red), overlapped non-ubi-PLSs (blue), or did not overlap cCRE-PLSs (gray). STAP-seq data on six transcriptional cofactors were available and the colors of the cofactors represent their preference for regulating TATA-box (purple) or CG-rich (orange) promoters. All P-values were computed with Wilcoxon rank-sum tests. (E) Hierarchical clustering of the six cofactors based on Pearson's correlation of STAP-seq signals across the 6471 promoter candidates overlapping cCRE-PLSs. (F) Ratios of the median STAP-seq signals for promoter candidates overlapping ubi-PLSs versus those overlapping non-ubi-PLSs.

