Figure 6.
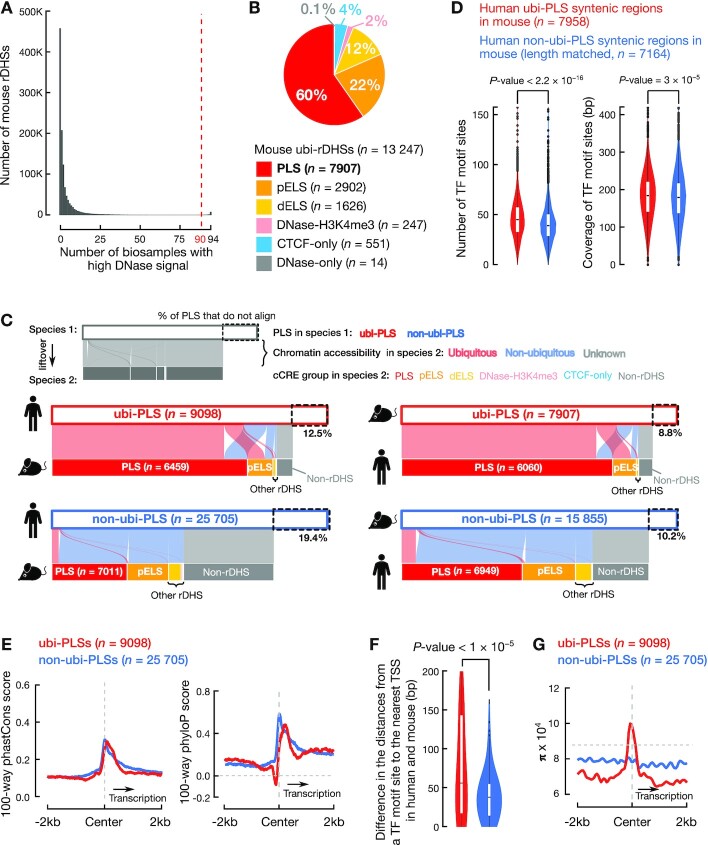
Human ubi-PLSs are conserved in mouse. (A) Definition of mouse ubi-rDHSs. A histogram shows the number of mouse rDHSs that have high DNase signals in a certain number of biosamples. rDHSs that have high DNase signals in 90 or more biosamples (out of a total of 94 biosamples) are defined as ubi-rDHSs in mouse. (B) The pie chart shows that 82% of mouse ubi-rDHSs are cCRE-PLSs or cCRE-pELSs. The category of ubi-rDHSs are as in Figure 1B. (C) Most human ubi-PLSs are also mouse ubi-PLSs and vice versa. The two alluvial plots on the left show the syntenic regions of human cCRE-PLSs in the mouse genome, and the two alluvial plots on the right show the syntenic regions of mouse cCRE-PLSs in the human genome. The color of a ribbon indicates whether a cCRE-PLS is ubiquitous (pink) or not (light blue) in the other genome, while a gray ribbon indicates that although some cCRE-PLSs can be lifted over to the other genome, they are no longer rDHSs in that other genome. (D) Human ubi-PLSs maintain their higher density and diversity of transcription factor binding sites in the mouse genome. As in Figure 4A, mouse regions that are lifted over from human ubi-PLSs (red) have more transcription factor binding sites and higher transcription factor binding site coverage than the mouse regions lifted over from human non-ubi-PLSs (blue). All P-values were computed with Wilcoxon rank-sum tests. TF: transcription factor. (E) Average 100-way phastCons scores (left) and phyloP scores (right) of the ±2 kb genomic regions centered on human ubi-PLSs (red) and non-ubi-PLSs (blue). The horizontal dashed gray line denotes the background phyloP score of zero. The vertical dashed gray line indicates the center of cCRE-PLSs. (F) Violin-box plots show the distributions of the difference between human and mouse in the distance from transcription factor motif sites in ubi-PLSs (red) and non-ubi-PLSs (blue) to the nearest TSS. The Wilcoxon rank-sum test P-value is shown. TF: transcription factor. (G) Average nucleotide diversity (π) in the ±2 kb genomic regions centered on human ubi-PLSs (red) and non-ubi-PLSs (blue). The horizontal dashed gray line represents the genome-wide background level of π. The vertical dashed gray line indicates the center of cCRE-PLSs.

