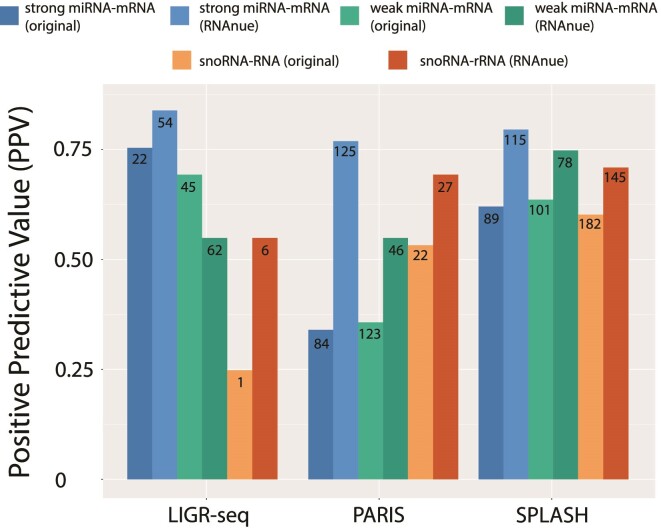
Figure 4.
Performance of RNAnue in comparison to the original analyses. The positive predictive value (PPV) corresponds to the fraction of detected interactions involving microRNAs, that are listed in miRTarBase 7.0 and snoRNA-rRNA interactions listed in snoDB 1.2.1. Numbers within bars represent total number of true positives.

