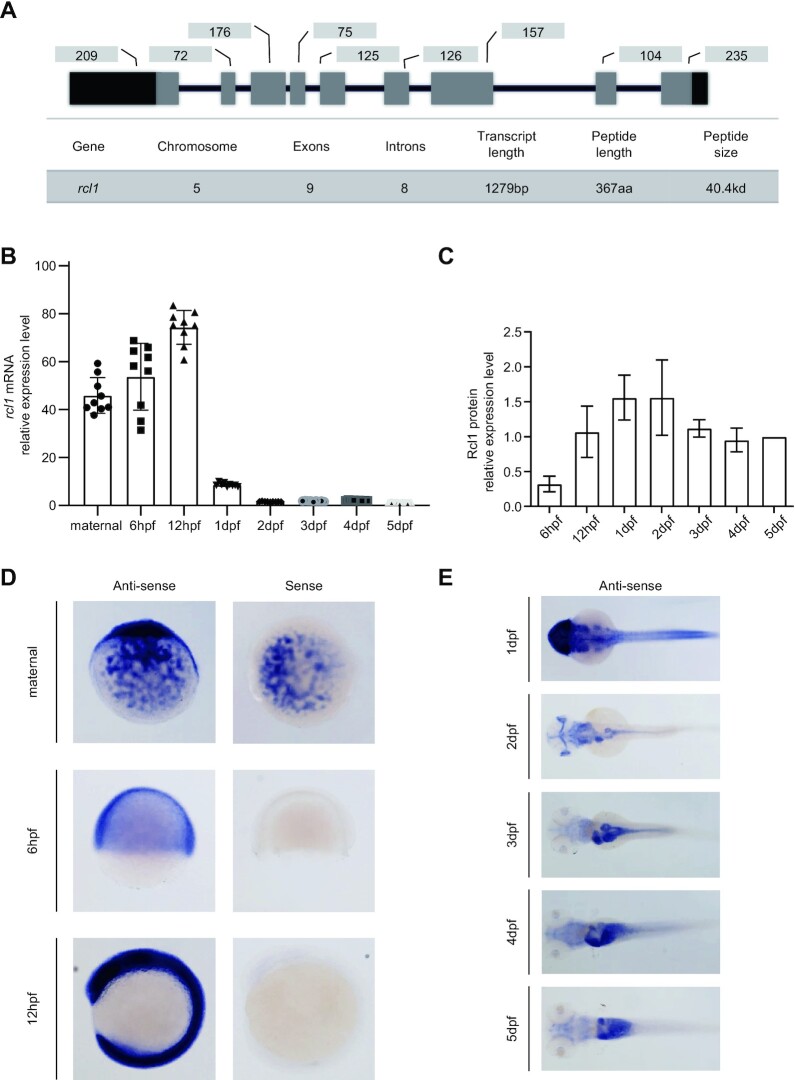
Figure 1.
Expression of rcl1 is enriched in the digestive organs during organogenesis. (A) Upper panel: a schematic diagram showing the genomic structure of the zebrafish rcl1 gene on chromosome 5. Lower table: summarizing the genomic and transcript information for the rcl1 gene. Dark bar, exon, 5′- and 3′-untranslated region (UTR); gray bar, exon, protein coding region; dark line, introns. Numbers above each exon indicate the length (bp) of reach corresponding exon. (B) Real-time quantitative PCR (qPCR) analysis of rcl1 transcripts at different developmental stages. Total RNA was extracted from a clutch of 100–300 eggs/embryos for each time point. Three repeats, each with triplicate qPCR analysis, were performed. Relative expression level of rcl1 was presented after normalization against gapdh. (C) Statistical analysis of Rcl1 protein levels at different developmental stages from three western blots (Supplementary Figure S3C–E). Total proteins were extracted from a clutch of 100–200 embryos for each time point. The relative signal intensity of the Rcl1 protein band was presented after normalization against the Tubulin control for each time point. (D and E) Whole-mount in situ hybridization (WISH) analysis of the rcl1 expression patterns at different developmental stages using an anti-sense rcl1 probe. The rcl1 sense probe was used as a negative control (D). hpf, hours-post-fertilization; dpf, days-post-fertilization.

