Figure 4.
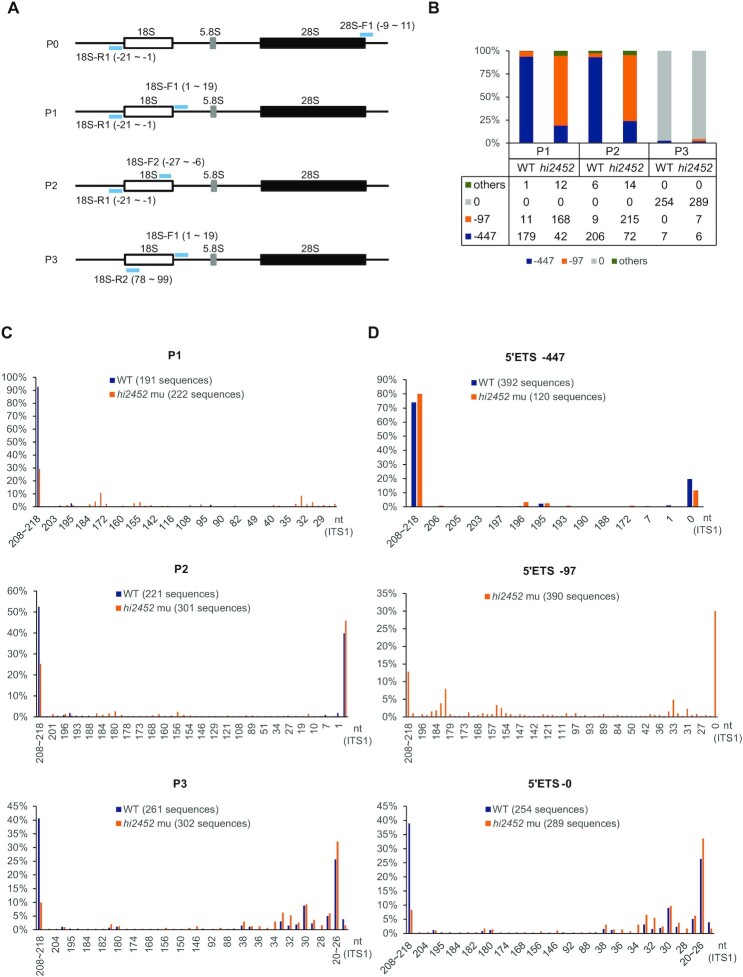
Depletion of Rcl1 compromised the cleavage of 18S pre-rRNA at the A1-site. (A) Schematic drawing showing the structure of the zebrafish pre-rRNA and the positions of four primer pairs (light blue bar) used in IPCR. P0: 18S-R1 (R1) and 28S-F1; P1: 18S-R1 and 18S-F1; P2: 18S-R1 and 18S-F2; P3: 18S-R2 and 18S-F1. (B) Histogram shows the ratios of -97nt, -447nt and other 5′ETS sequences based on sequencing the IPCR products obtained using the P1, P2 and P3 primer pairs, respectively. Table below the histogram shows the numbers of the sequenced single colonies (combined from three independent repeats) from WT and rcl1hi2452 for each primer pair. (C) Histogram comparing the patterns and ratios of ITS1 sequences between WT and rcl1hi2452 (hi2452) in the clones obtained by using P1, P2 and P3 primer pairs, respectively. (D) Histogram comparing the patterns and ratios of ITS1 sequences in the clones containing the –447nt 5′ETS (top panel) or without the 5′ETS sequence (5′ETS-0) (bottom panel) between WT and rcl1hi2452 (hi2452). Since there were very few (only 20 out of 673) WT clones containing the –97 5′ETS, in view of statistics, the analysis was only done for the rcl1hi2452 (hi2452) mutant (total 390 sequences available) (middle panel). In C and D, the number after WT and hi2452 represented the total number of sequences analyzed for each primer pair.

