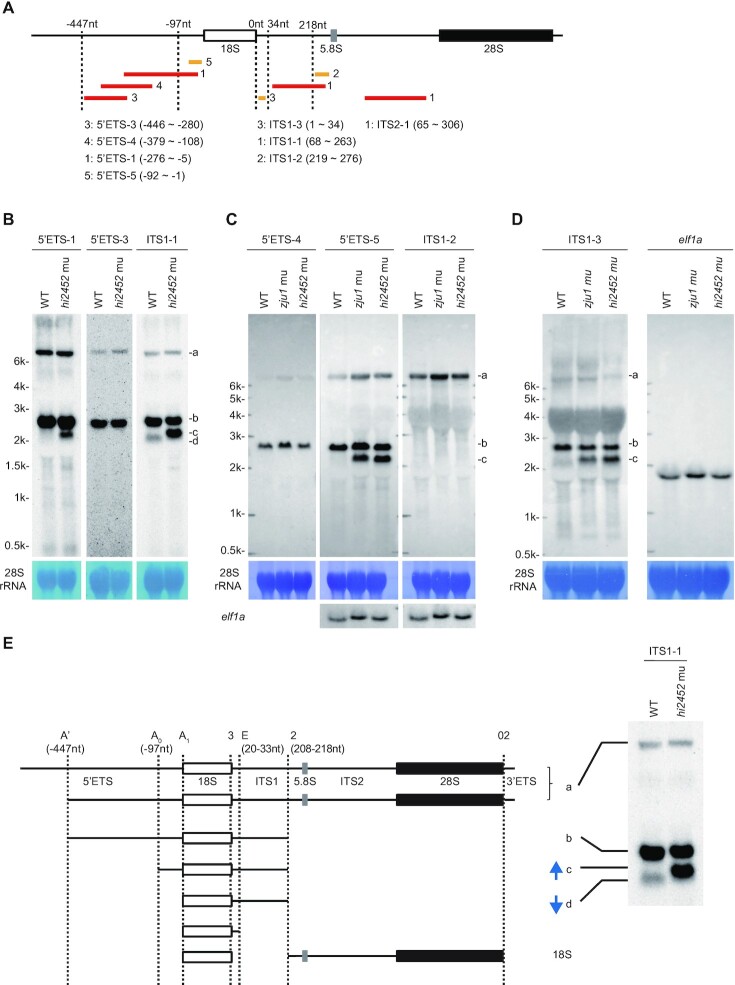
Figure 5.
Defining major processing steps for 18S rRNA maturation in zebrafish. (A) Schematic drawing showing the positions of 8 probes used in northern blotting analysis of different pre-rRNA intermediates. The relative –447nt and -97nt positions in the 5′ETS, 34nt and 218nt positions in the ITS1 are indicated. Red bar: DIG labelled probes; yellow bar: biotin labelled probes. The correspondence between the number after the red or yellow bar and a specific probe is highlighted. (B–D) Northern blot analysis of pre-rRNA intermediates in WT and rcl1hi2452 (B) or in WT, rcl1hi2452 and rcl1zju1 (C and D) at 5dpf using corresponding probes as indicated. The pre-rRNA intermediates are marked to the right as a, b, c and d. Methylene blue staining of 28S rRNA: loading control; elf1a in (C): loading control; elf1a in (D): same samples loaded twice on the same gel for electrophoresis, then the filter was cut and subjected to northern blot analysis using ITS1-3 and elf1a probes, respectively. (E) Diagram illustrates the major processing steps for 18S rRNA maturation in zebrafish. Cleavage sites at A′ (-447nt 5′ETS), A0 (-97nt 5′ETS) and A1 (5′ETS-0) in 5′ETS, at 2 (208–218nt ITS1) and E (20–33nt ITS1) in ITS1 and at 02 in 3′ETS are indicated by vertical dotted lines. The pre-rRNA intermediates a, b, c and d correspond to that detected in northern blots as shown on the right (copied from Figure 5B, panel for the ITS1 probe). Blue arrow indicates the up-regulation of band c and down-regulation of band d in rcl1hi2452 and rcl1zju1 mutants as evident in Figures 3D and 5B-D.

