Figure 6.

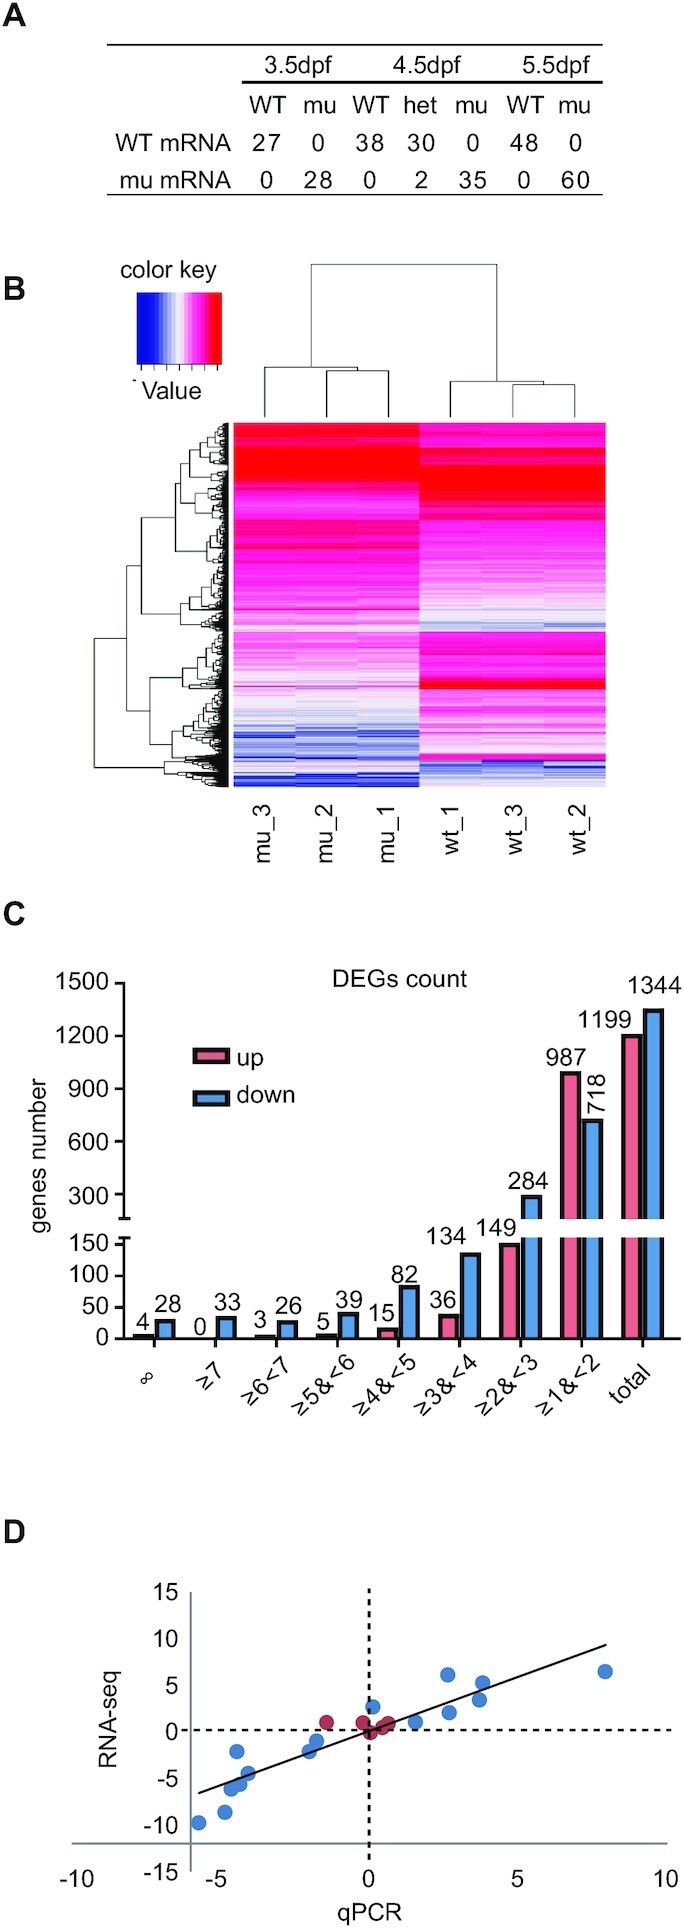
Depletion of Rcl1 causes down-regulation of 1344 genes and up-regulation of 1199 gene. (A) Sequencing analysis of WT rcl1 and mutant rcl1zju1 transcripts in the RT-PCR products obtained from WT, rcl1zju1/+ heterozygous and rcl1zju1 homozygous progenies of the rcl1zju1/+ intercross at 3.5dpf, 4.5dpf and 5.5dpf. (B) Hierarchical Clustering analysis of the RNA-seq data between WT and rcl1zju1 mutant with three biological repeats. (C) The log2 value distributions of the 1,199 significant up-regulated and 1,344 down-regulated genes (cut-off value: log2≧| , P <0.05) in rcl1zju1 mutant at 4.5dpf. (D) Confirmation of the RNA-seq data by the qPCR analysis of 20 randomly selected genes in WT and rcl1zju1 mutant. Expression data of genes detected by RNA-seq was plotted against those by qPCR. The reference line indicates the linear correlation between the RNA-seq and qPCR. Blue dot: gene with significant change in RNA-seq; red dot: gene without significant change.
