Figure 7.
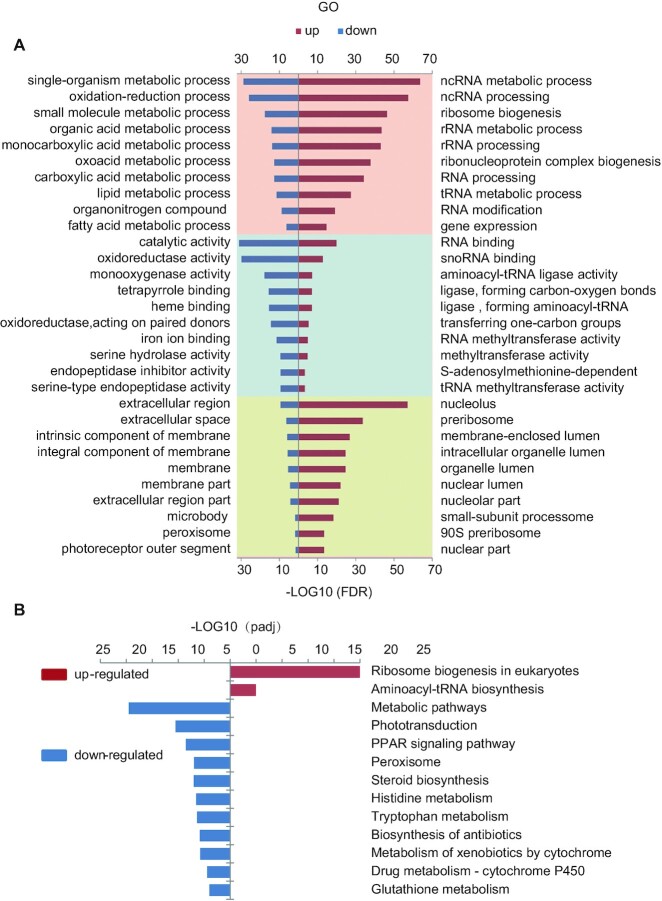
GO and KEGG enrichment analysis of the DEGs reveled an up-regulation of a cohort of genes related to ribosome biogenesis. (A) Top 10 significantly enrichment GO analysis for up-regulated (right panel, red bar) and down-regulate (left panel, blue bar) DEGs in BP, MF and CC items. BP: biological process (pink panel, top); MF: molecular function (light blue panel, middle); CC: cellular component (yellow panel, bottom). (B) Significantly enriched KEGG pathway for up-regulated (right panel, red bar) and down-regulate (left panel, blue bar) DEGs.

