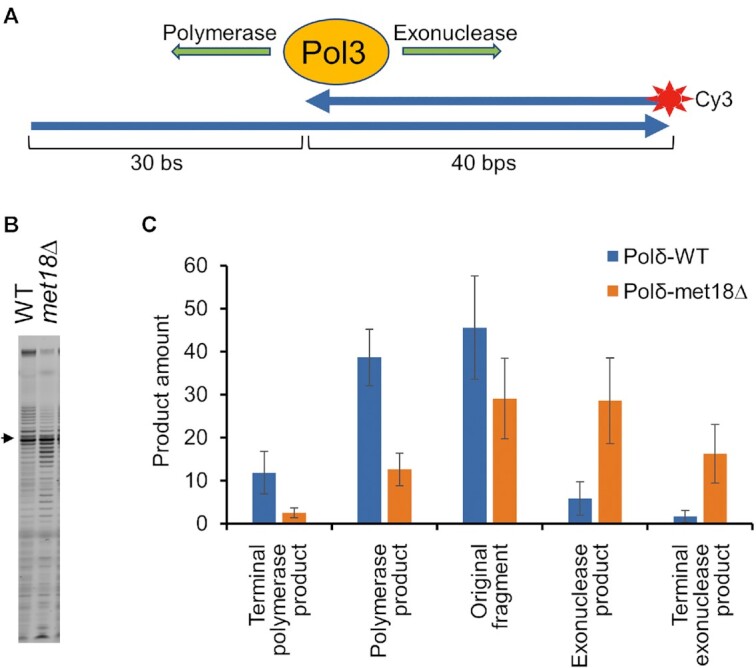
Figure 5.

Analysis of in vitro DNA synthesis catalyzed by Pol δ isolated from wild-type and met18 strains. Error bars show standard deviations. (A) Schematic of the primed-template DNA synthesis assay used to evaluate the catalytic activity of Pol3p (details in Supp. Expt. Procedures). (B) Gel analysis of the Cy3-labeled DNA synthesis products generated as shown in Figure 5A. The arrow shows the position of the 40 bp primer. Products that migrate more slowly than the primer indicate DNA synthesis; products that migrate faster than the primer indicate exonuclease activity. (C) Quantitation of the reaction products shown in (B).
