
Fig. 3. 2′-dFC inhibition of CCHFV visualized using high-content imaging.
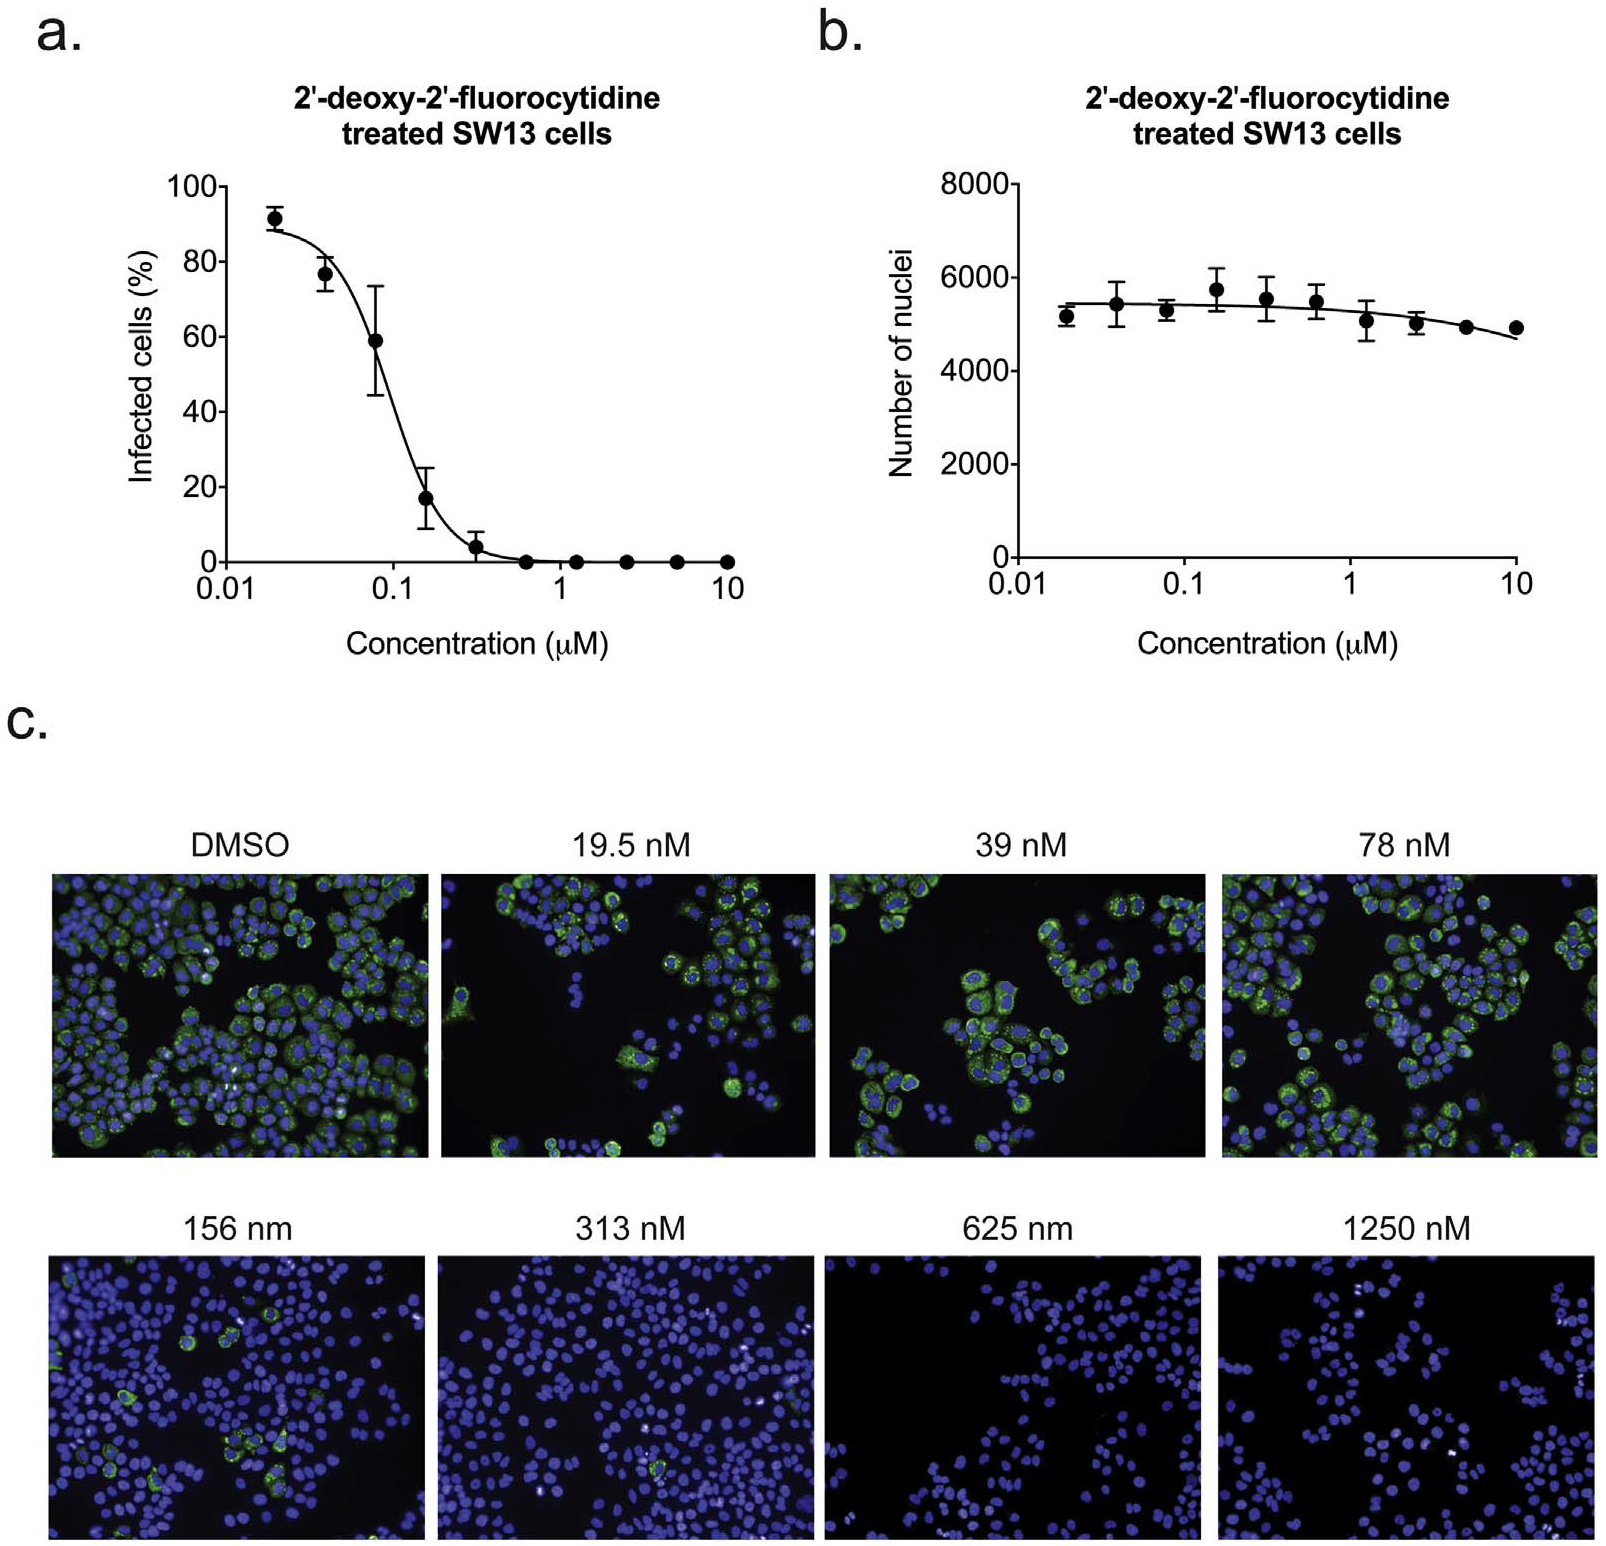
Dose-response curve in SW13 cells treated with a 2-fold serial dilution of 2′-dFC before infection with CCHFV at MOI 0.1. At 48 hpi, cells were fixed and stained with anti-CCHFV polyclonal antibodies, CellMask Red, and Nuc-Blue to visualize viral proteins, cell cytoplasm, and cell nuclei, respectively. a. The percentage of infected cells at each concentration of compound was calculated by determining the proportion of cells expressing CCHFV proteins compared to total cell number (based on CellMask Red). b. Cell viability assessed by determining the number of Nuc-Blue-stained nuclei. c. Representative images at indicated 2′-dFC concentrations show the reduction in CCHFV protein production (green) in the absence of any cytotoxicity (Nuc-Blue-stained nuclei). CellMask Red staining was omitted from these images for clarity. (For interpretation of the references to colour in this figure legend, the reader is referred to the web version of this article.)