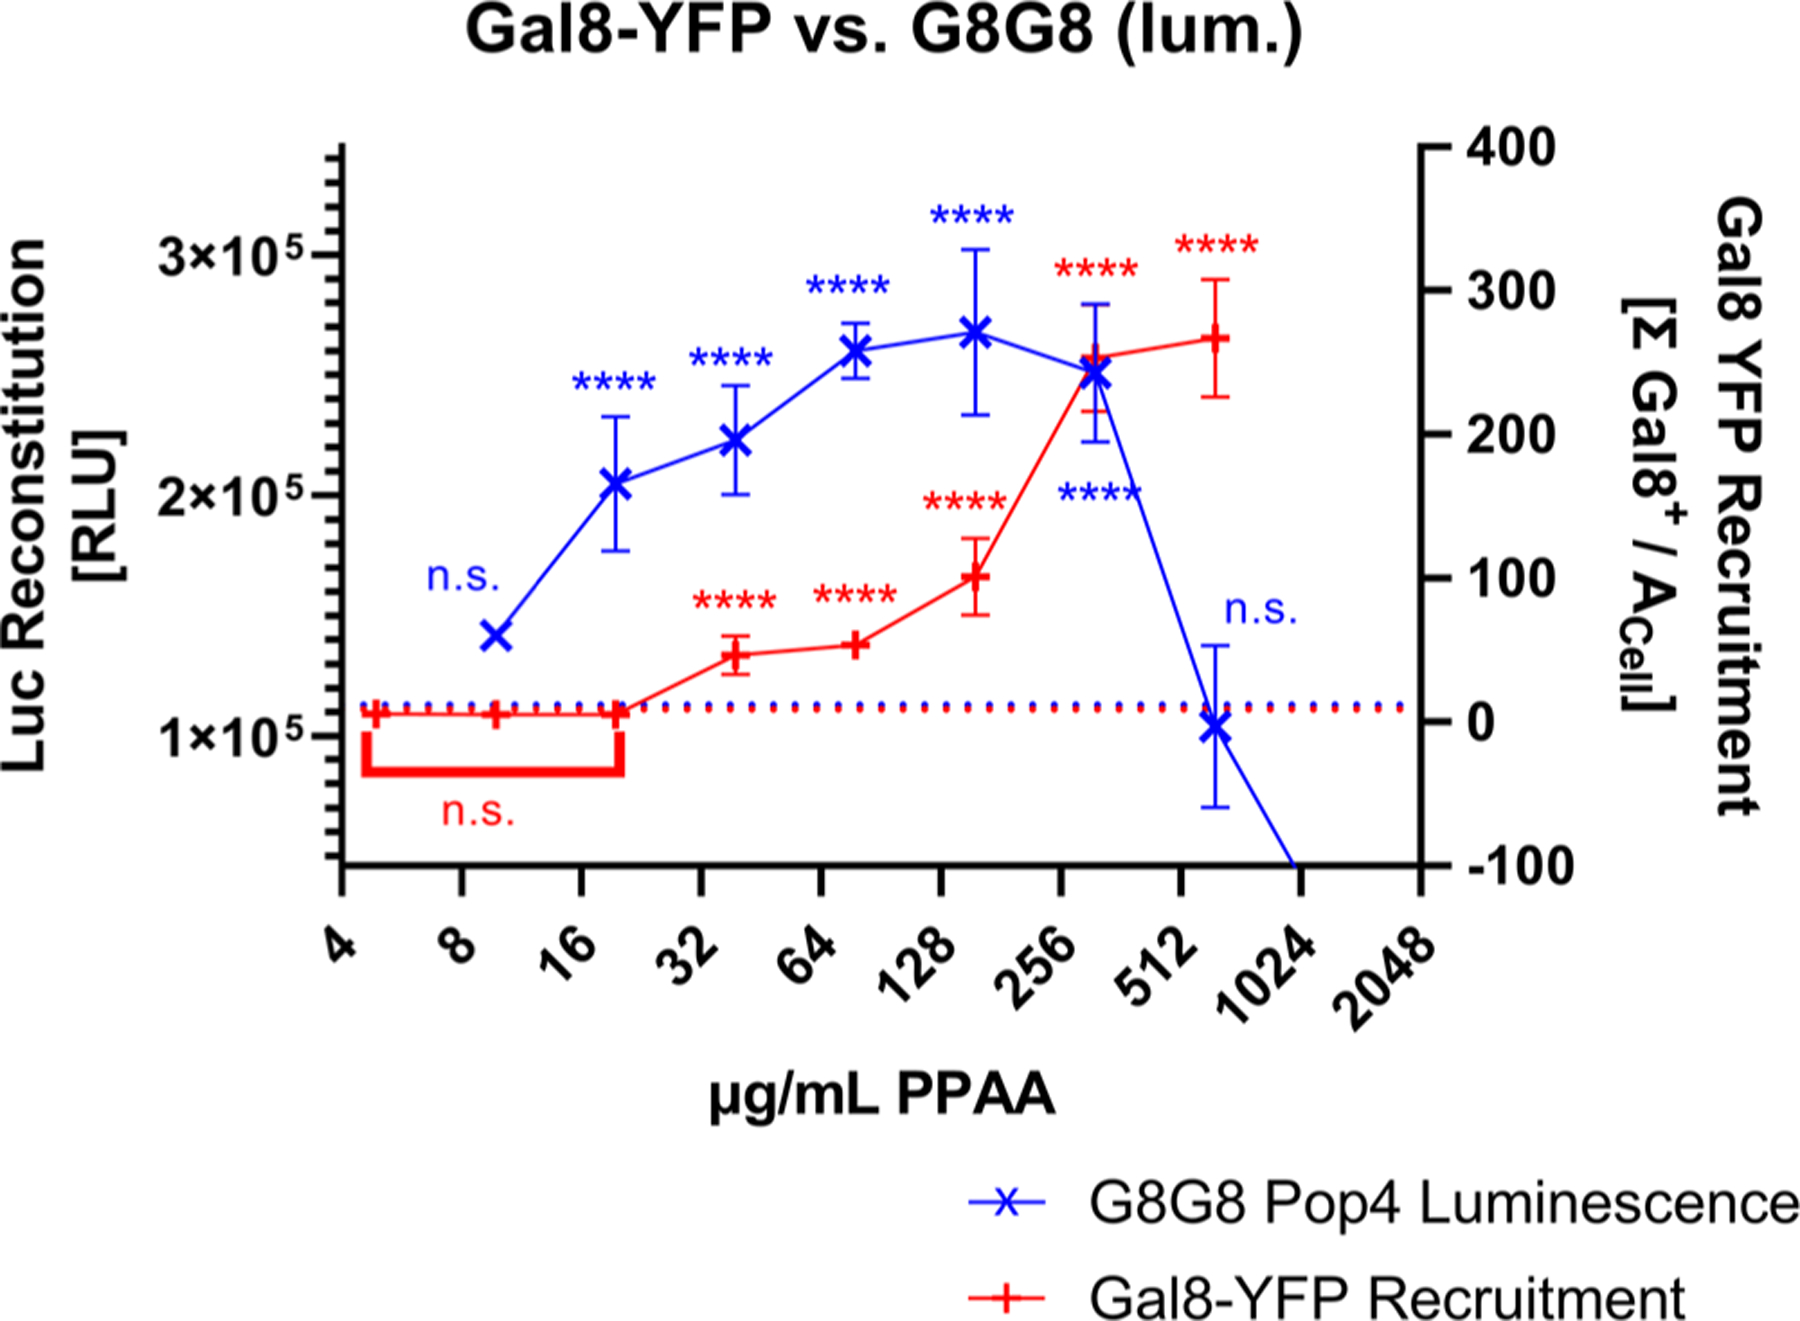
Figure 3.

G8G8 cross-validation with the Gal8-YFP assay. Gal8-YFP and G8G8 HEK-293-T cells were treated with a twofold dilution series from 1250 to 9.8 μg/mL PPAA for 2 h. G8G8 luminescence data are plotted in blue as × on the left y-axis. Gal8-YFP response data are plotted in red as + on the right y-axis. Buffer treatment control responses for both assays were aligned and plotted as a dotted line; maximal responses were also aligned to compare responses. Error bars represent standard deviation.
