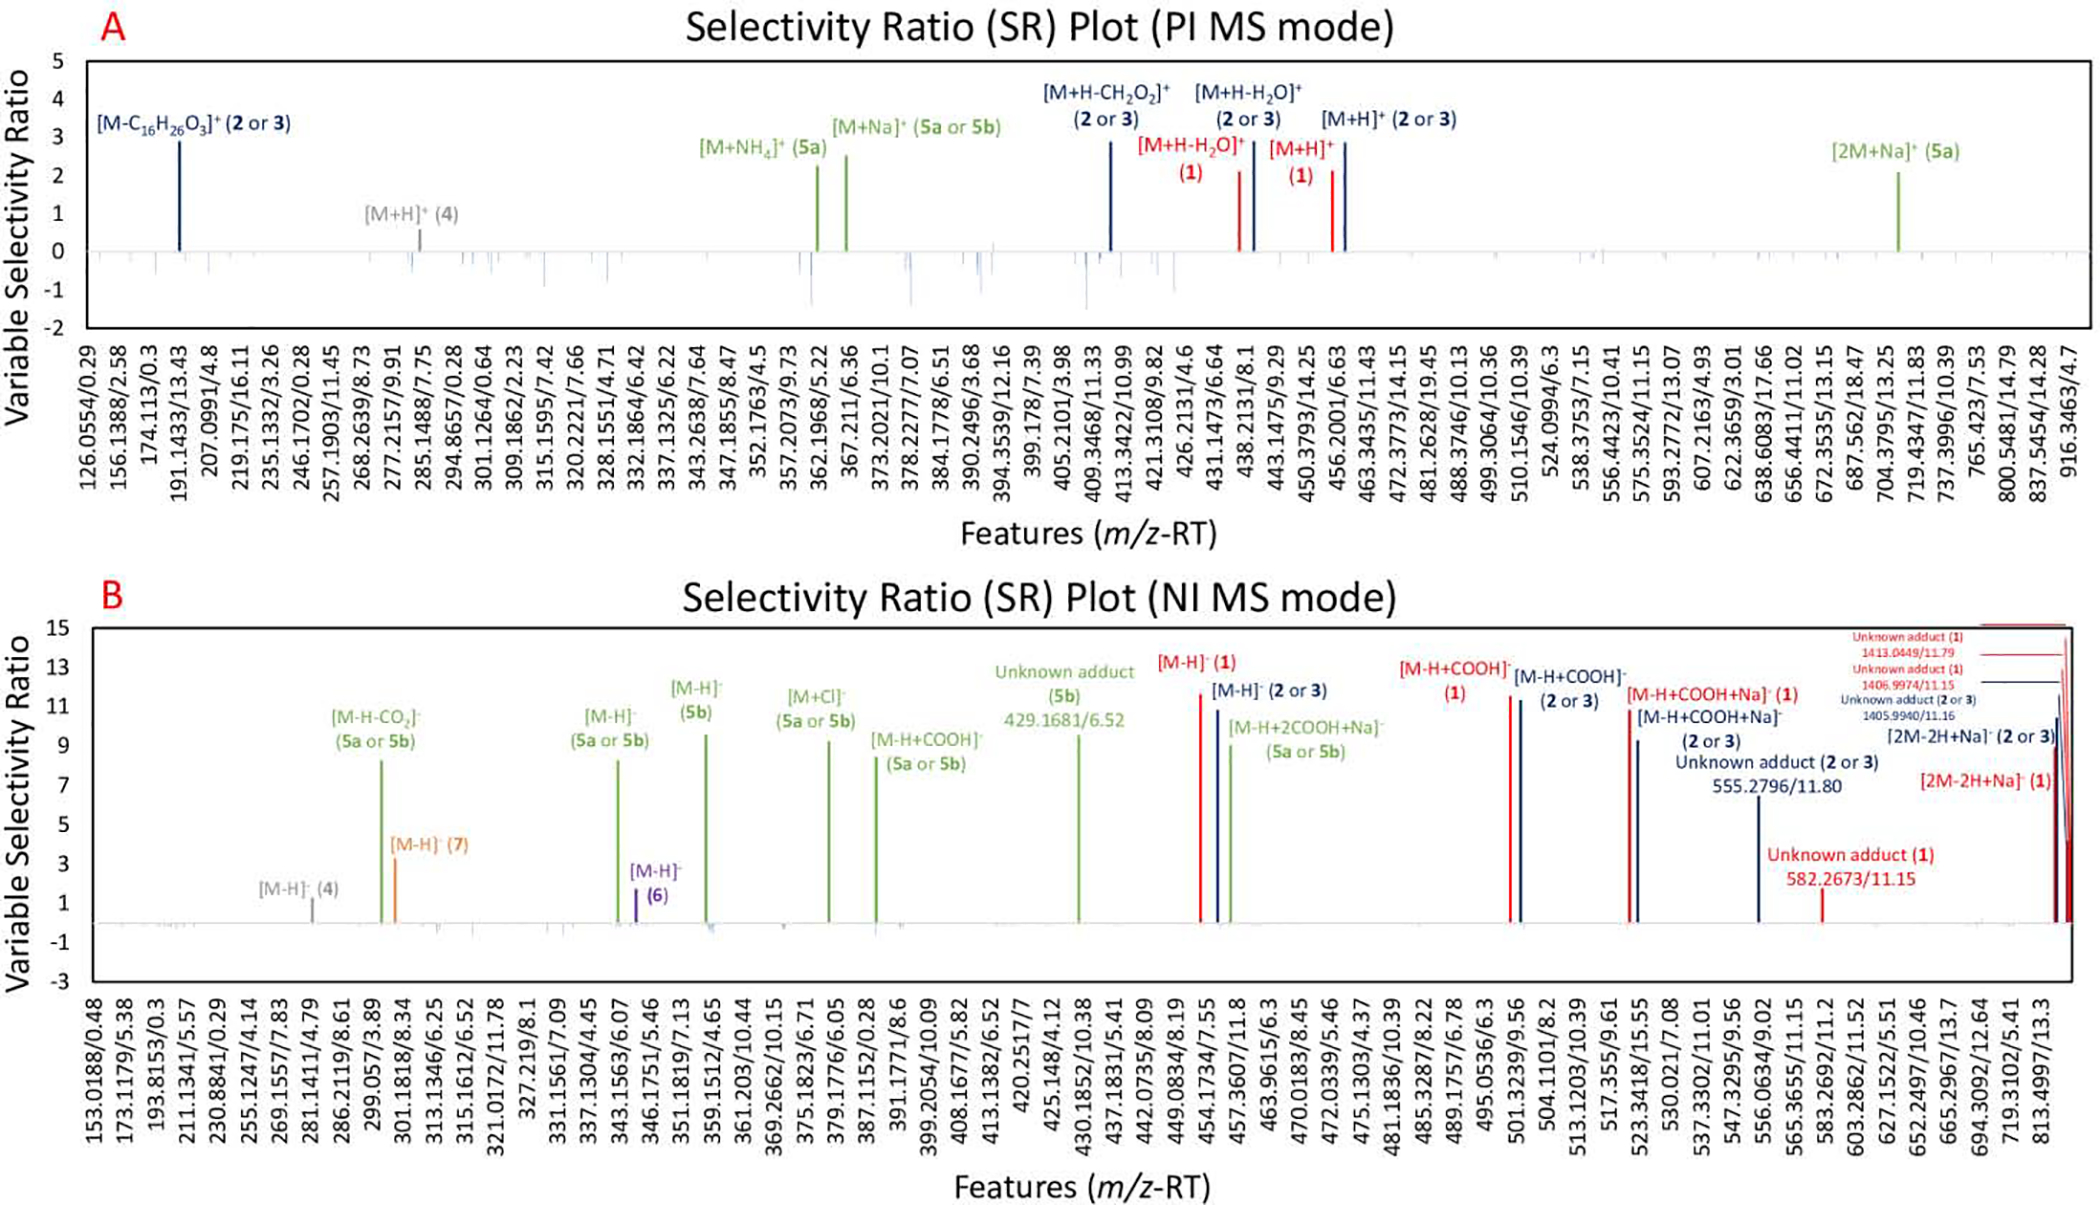
Figure 5.

Selectivity ratio (SR) plot for multivariate statistical analysis for ions detected in first stage RO-5 fraction and its subfractions, RO-5–1 through RO-5–6. The data was collected using UPLC-HRMS. Percent inhibition measurements against MRSA after 18–24 hours were used as a dependent variable. The x-axis shows the features (identified by a unique m/z and retention time) detected in the metabolomics dataset. Features are shown in the order of increasing m/z value and color-coded based on compounds. Variable selectivity ratio is shown on the y-axis and higher ratio indicates stronger correlation with the percent inhibition. 5A. SR plot analysis in positive (PI) MS mode. 5B. SR plot analysis in negative (NI) MS mode. In both figures, micromeric acid in red (1), oleanolic acid (2) or ursolic acid (3) in blue, and their related features had high SR ratios, confirming their positive correlation to the bioactivity of RO-5–4 fraction. Unknown adducts are labelled along with their features (m/z-RT). Additional tentative annotations of the features can be seen in Table 1.
