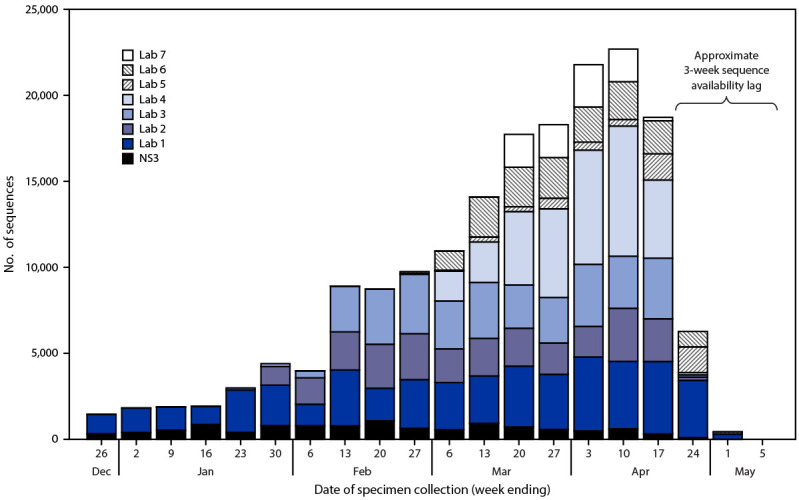
FIGURE.

Number of SARS-CoV-2 genomic sequences generated by National SARS-CoV-2 Strain Surveillance or reported to CDC by commercial laboratories* for specimens collected December 20, 2020—May 6, 2021, by laboratory source — United States, May 6, 2021
Abbreviation: NS3 = National SARS-CoV-2 Strain Surveillance
* Sequences generated by or reported to CDC through NS3 and contract laboratories do not include the >5,000 sequences per week produced by public health laboratories and other U.S. institutions, which are not currently integrated into CDC’s surveillance for SARS-CoV-2 variants using genomic sequencing. https://covid.cdc.gov/covid-data-tracker/#published-covid-sequences
