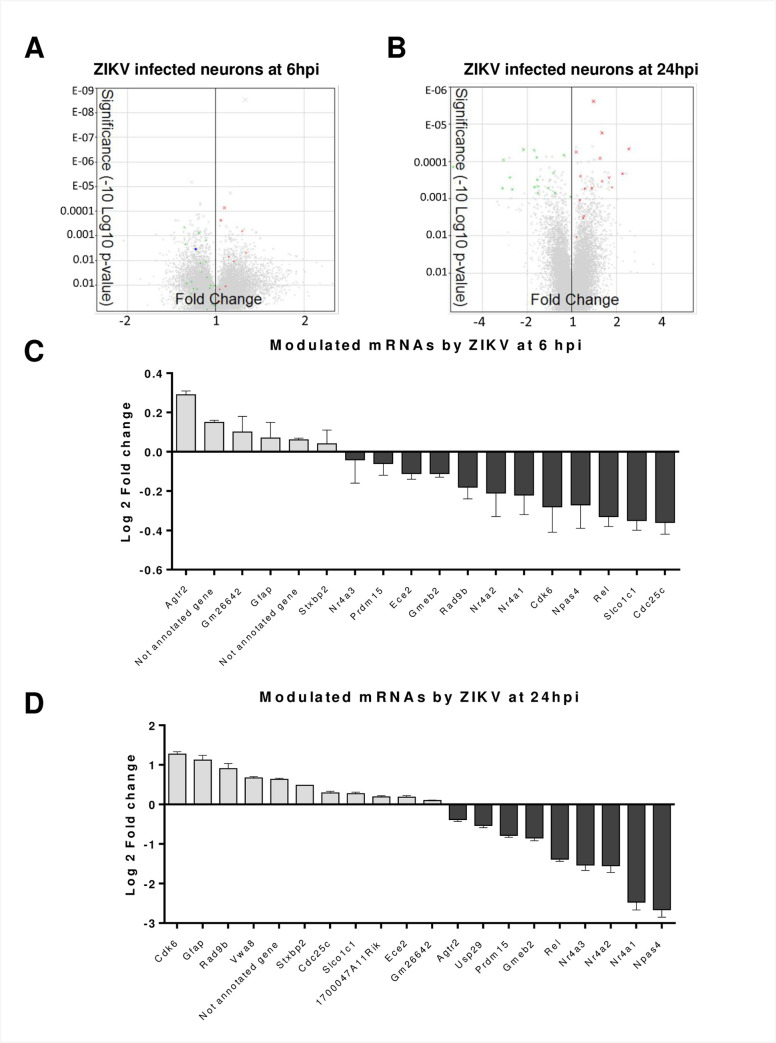
Fig 2. Transcriptome analysis of ZIKV infected neurons.
Total RNA was collected at 6 and 24 hpi, and mRNA variations were analyzed by microarrays. A and B) Volcano plot of total differentially expressed genes after ZIKV infection at 6 hpi (A) and 24 hpi (B). Differentially expressed genes with a cut-off FDR ≤ 0.05 are in green (downregulated) and red (upregulated) dots. C) Bar plot of genes with an FDR ≤ 0.05 at 6 hpi*. Grey bars represent the upregulated genes whereas black bars are the downregulated genes. The x-axis shows gene names and the y-axis shows Log2FC. D) Bar plot of genes with an FDR ≤ 0.05 at 24 hpi*. Grey bars represent the upregulated genes whereas black bars are the downregulated genes. The x-axis shows gene names and the y-axis shows Log2FC. *Nr4a2 is shown in C and D despite an FDR value of 0.0563.

