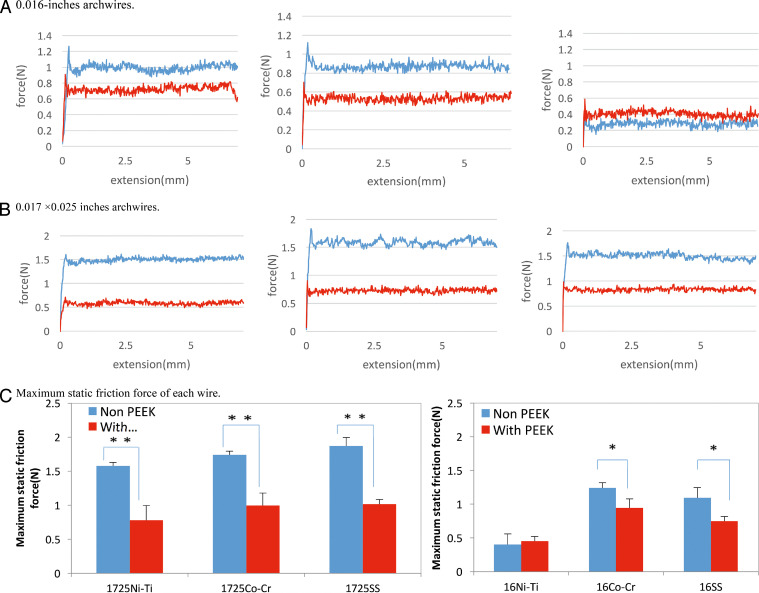
Figure 6.
Friction test results for the (a) 0.016-inch and (b) 0.017 × 0.025-inch wires. Blue indicates no tubes, red indicates wires covered with tubes. (c) Maximum static friction force of each wire. The measured value represents the average of five experiments. * Significant difference at P < .05; ** Significant difference at P < .01.

