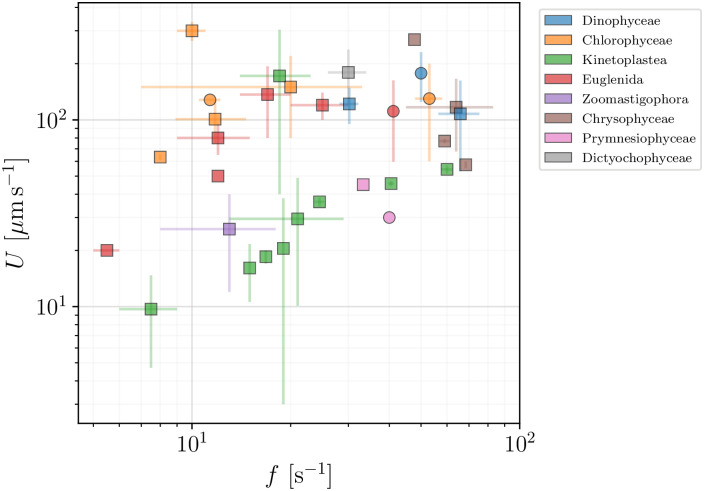
Fig 10. Swimming speed, U (μm s−1), plotted versus the frequency of flagellar beat, f (s−1), for flagellated eukaryotes in our dataset (excluding spermatozoa and ciliates).
Colours mark different classes and sub-classes. Wave-producing organisms are plotted in squares and the remaining flagellated eukaryotes are plotted in circles.

