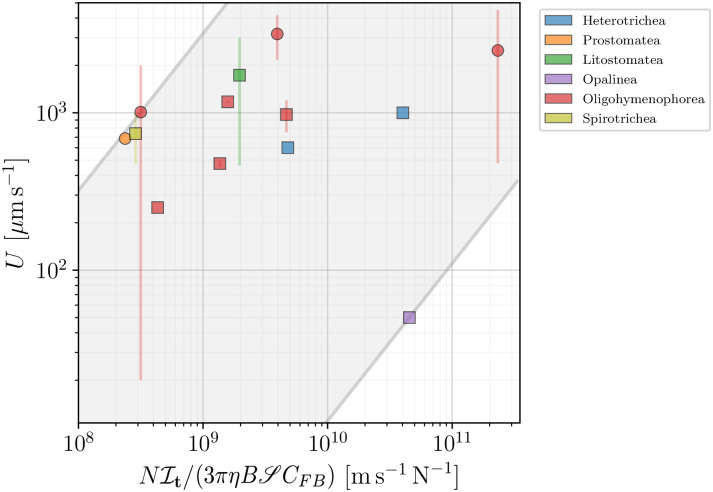
Fig 22. Reported swimming speed U plotted against the numerical prefactor of Eq (42), assuming a constant effective force per cilium in the propulsion model (B).
Square symbols mark organisms for which the prediction was directly calculated from the available data, while circles represent those for which we estimated the number N of cilia. Colours distinguish the different taxonomic classes. The visible large scatter of data sets the bounds for the effective force per cilium to be in the range of 1.10 10−3 to 3.19 pN, represented by the shaded area in grey.

