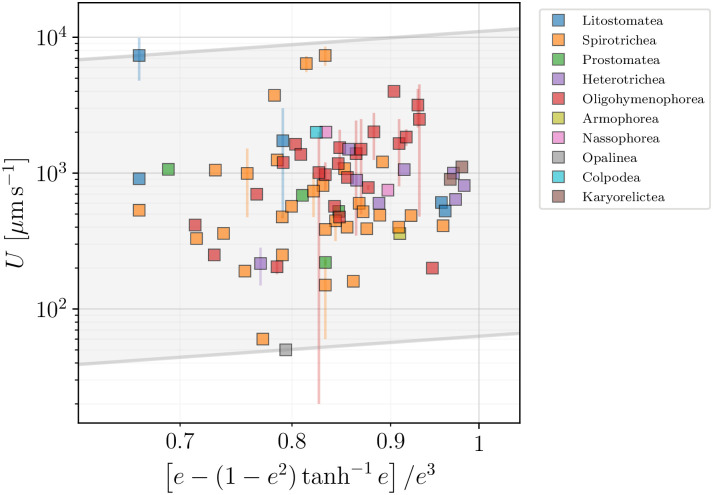
Fig 23. Reported swimming speeds from our database U plotted against the geometric factor from Eq (45) for the constant-flow model (C).
The data can be used to estimate the range of effective surface velocities to be in the range from 63.0 μm s−1 to 1.10 104 μm s−1, in the grey shaded area. Colours allow to distinguish different taxonomic classes.

