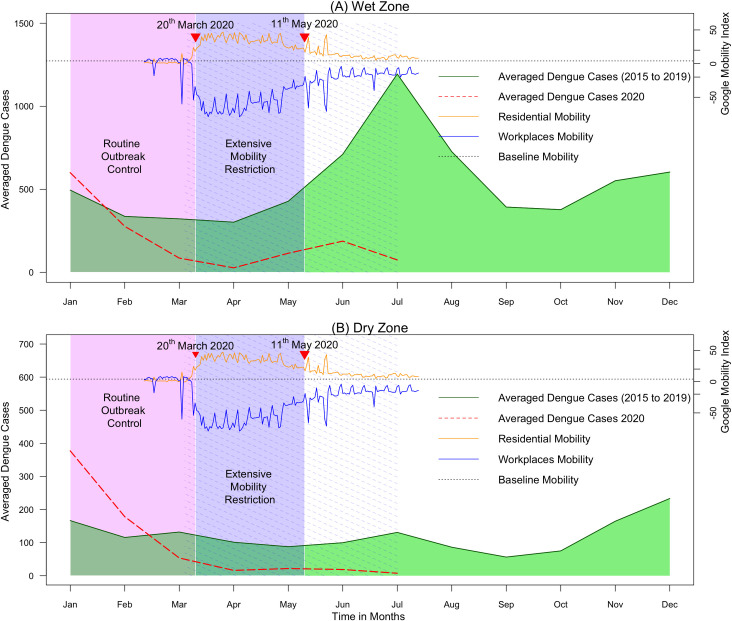
Fig 2. Reported dengue cases during 2020 compared to monthly averaged dengue cases reported from 2015 to 2019 averaged across all districts in climate zones in Sir Lanka.
(A) Wet zone. (B) Dry zone. The green solid line shows the five-year average. Red dashed line shows cases reported during 2020. The purple solid area indicates the period of extensive mobility restriction; the purple dashed area indicates the period of school closure; the pink area indicates the period of routine dengue outbreak control interventions. The residential mobility represents the percentage change of daily mobility compared to the baseline residential mobility; the workplace mobility represents the percentage change in daily mobility compared to the baseline workplace mobility.

