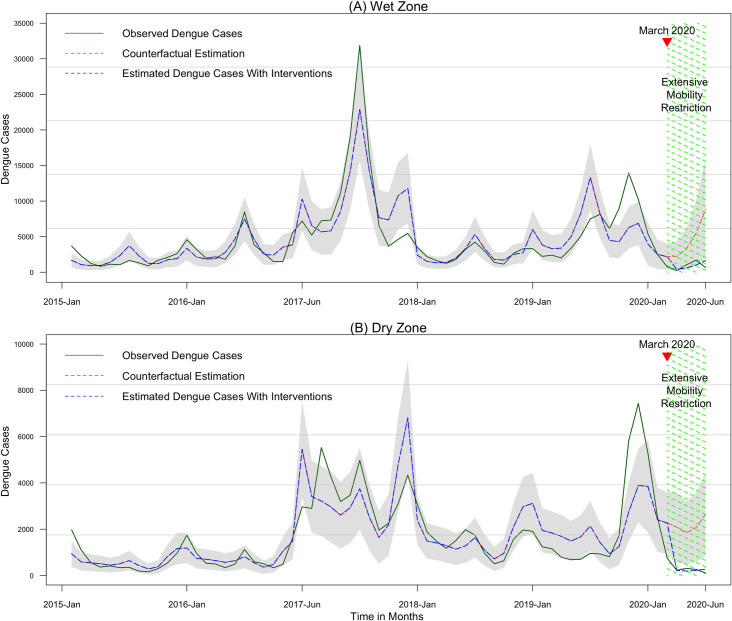
Fig 4. Time series plot of observed and estimated dengue cases from 2015 to 2020 July in wet and dry zones in Sri Lanka.
(A) Wet zone. (B) Dry zone. The green line represents observed dengue cases. Blue dashed line represents the model predicted or estimated dengue cases with the lockdown intervention in place. The red dashed line represents estimated dengue cases without intervention or the counterfactual estimation. The grey zone indicates the lower and upper limits of the 95% confidence intervals for estimated dengue cases at each month.

