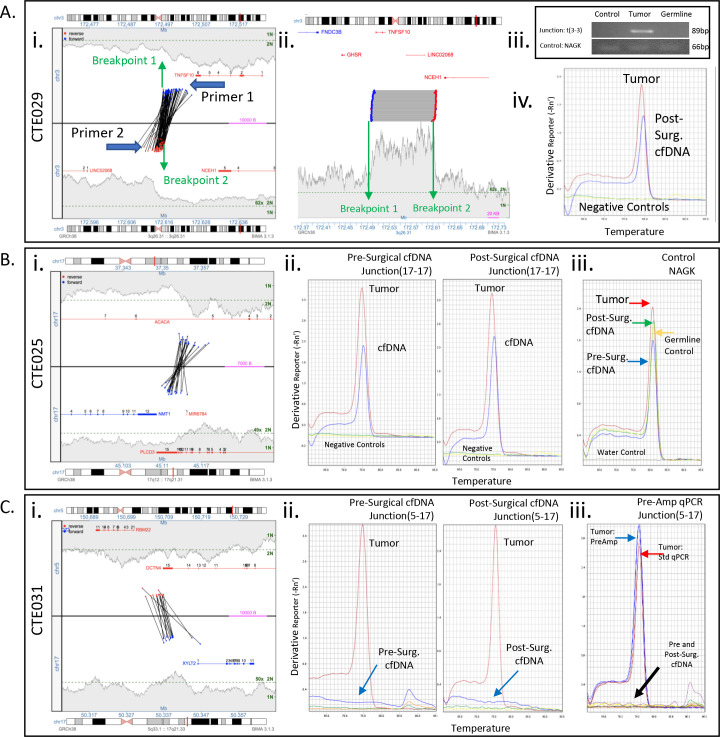
Fig 3. Junction primer design and qPCR cfDNA detection results.
(A) Case CTE029. Left Panel: Junction plots of selected intrachromosomal junction of chromosome 3 with base positions 172MB–173MB (3a–3b). The middle line separates the 2 chromosomal areas involved in the junction. The lines across show the fragments that span the junction and support the rearrangement. The position of each read of a supporting fragment is located by a dot and color coded by strand, red for reads mapping to the reverse strand, blue for forward strand. The bridged coverage for the region is illustrated by the shaded area. The green dotted line on the y–axis indicates the bridged coverage averaged across the entire genome (normalized to estimate 2N and 1N). Genes within the region are displayed, indicating exon location and strand direction. General relative positions and directions of designed primers indicated. Middle panel: Linear plot of junction. Right Panel: Standard endpoint PCR of junction 3a–3b and amplification control product NAGK in pooled genomic DNA, patient tumor, and patient PBMCs. Sybr green qPCR amplicon melting curve for 3a–3b junction in patient 6–week post–surgical cfDNA. (B) Case CTE025. Left Panel: Junction plot of selected junction. Middle Panels: Sybr green qPCR melting curve of amplicons of 17a–17b junction in patient pre–and post–surgical cfDNA. Right Panel: qPCR melting curve for control product NAGK. (C) Case CTE031. Left Panel: Junction plot of selected junction. Middle Panels: Sybr green qPCR melting curve of amplicons of 5–17 junction in patient pre–and post–surgical cfDNA. Right Panel: qPCR melting curve for junction 5–17 in presurgical cfDNA following 30 cycles of pre–amplification.

