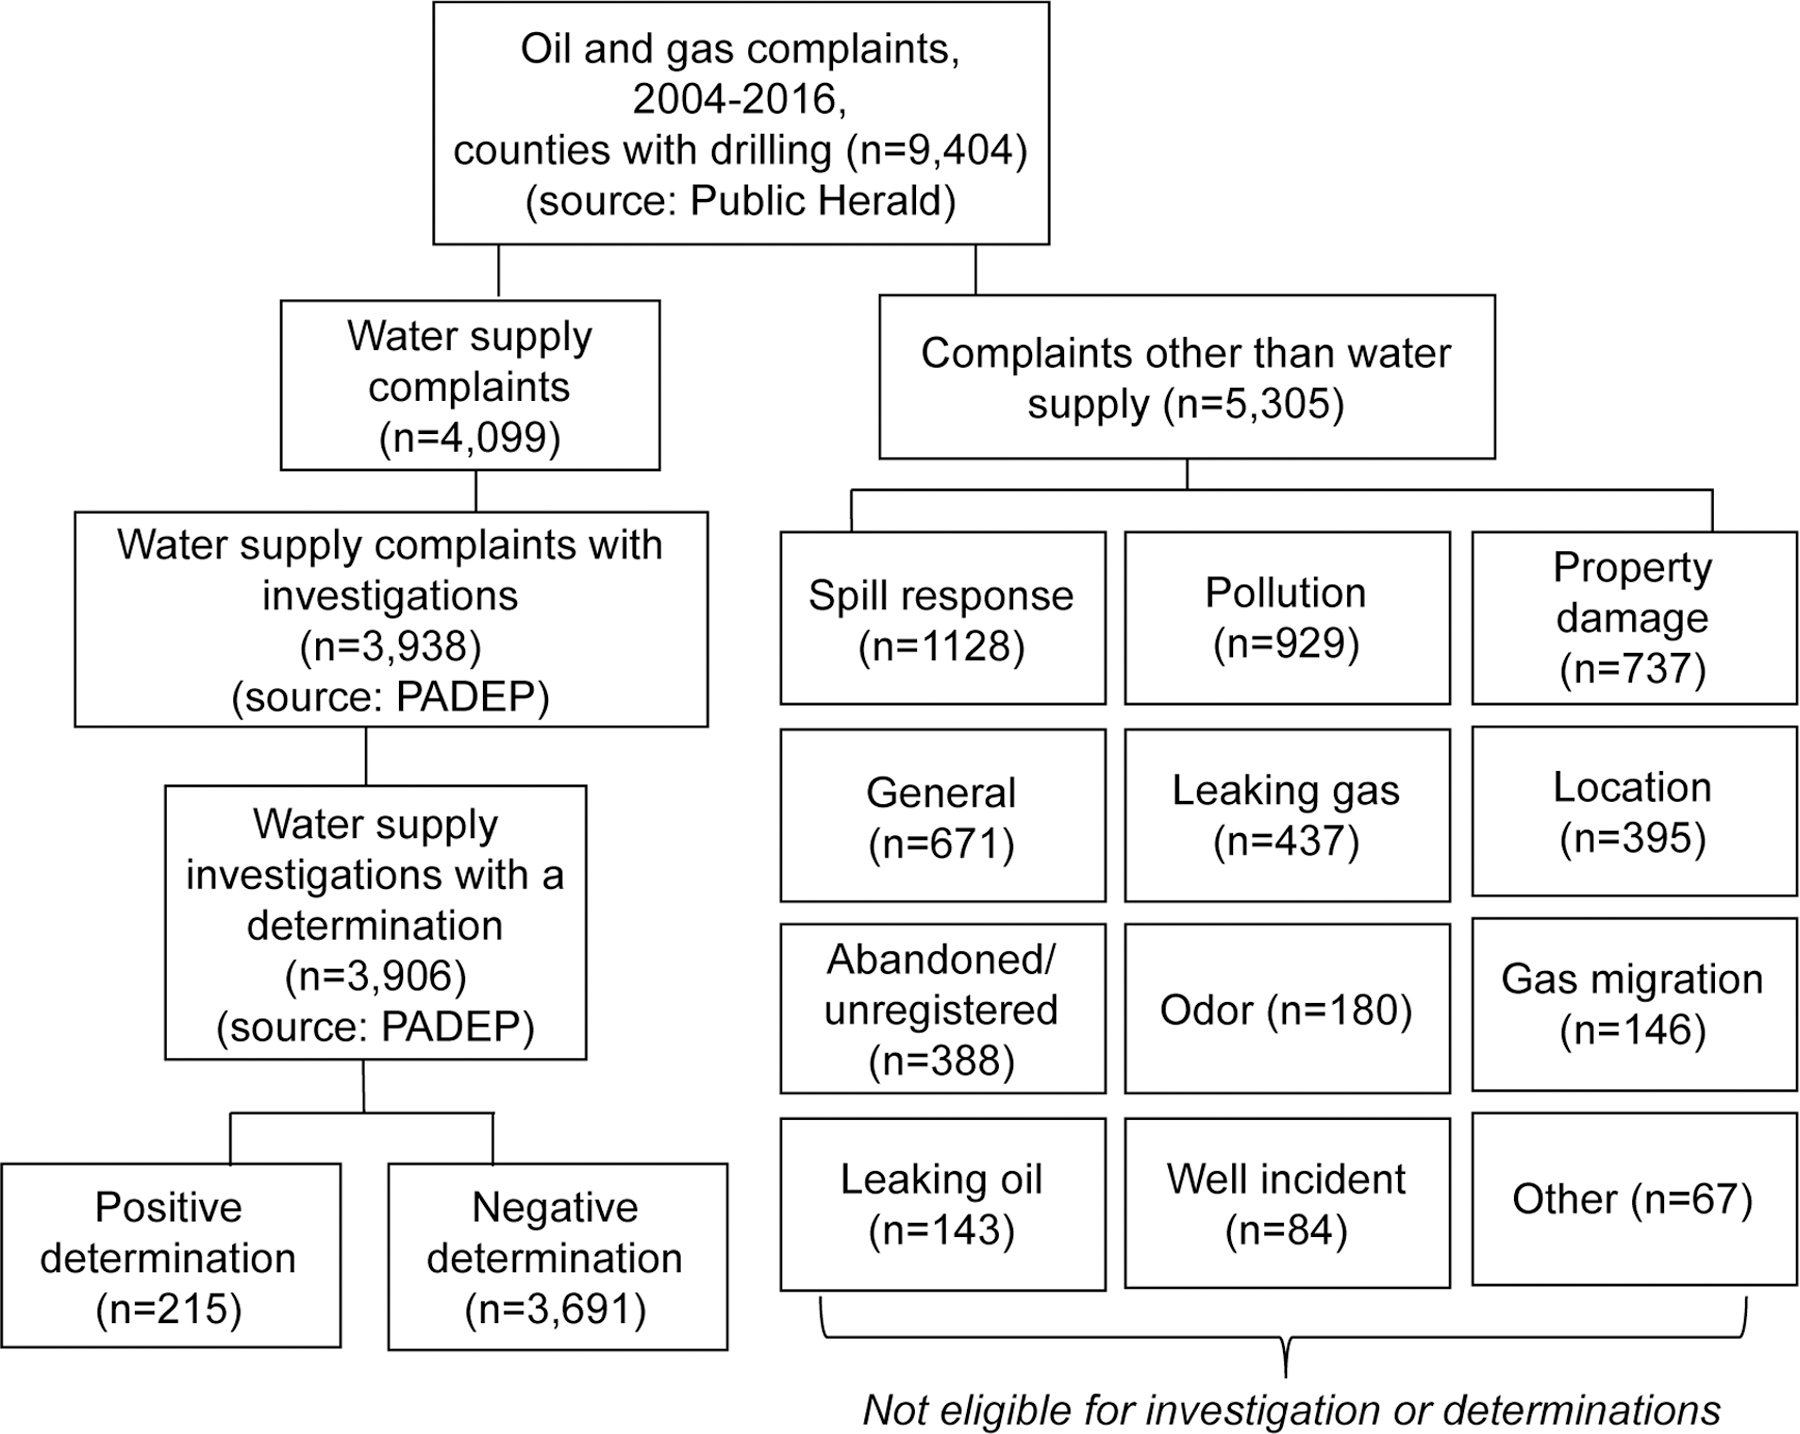
Figure 2. Flow chart of complaint and determination data acquisition and categorization.

Overview of the aggregated sources of oil and gas complaints and determinations data. Endpoints used in analyses are all oil and gas complaints (9,404), number of positive water supply determinations (215), and proportion of completed water supply investigations (denominator, 3,906) yielding a positive determination (numerator).
PA: Pennsylvania, PADEP: Pennsylvania Department of Environmental Protection
