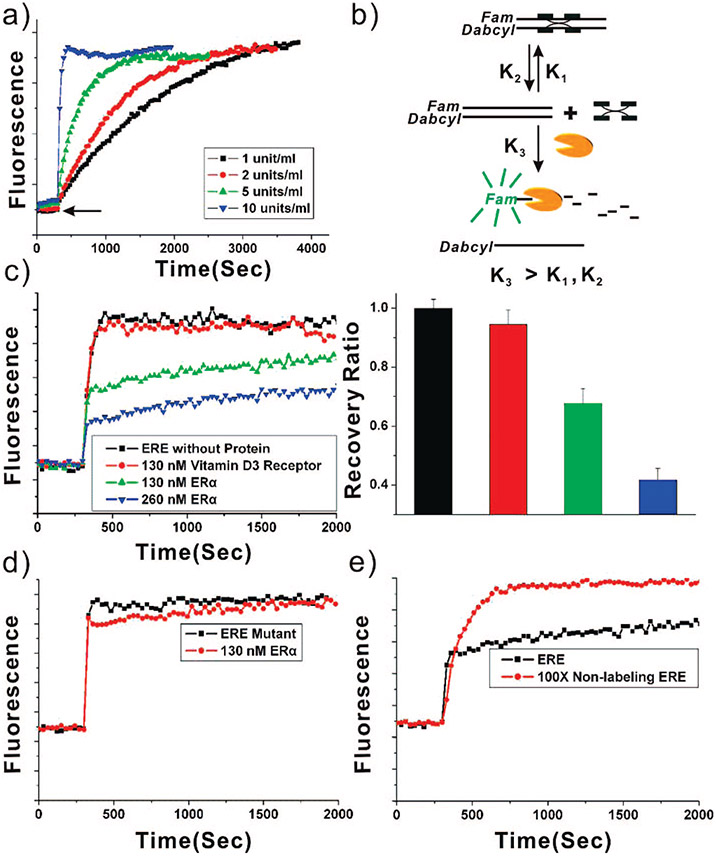
Figure 1.
Experimental optimization of the single-target fluorophore recovery system. (a) Kinetic FAM fluorescence emission curves (λex = 495 nm, λem = 515 nm) for the digestion reaction as a function of time for various concentrations of Exo III (1, 2, 5, and 10 U/mL). (b) Scheme showing exonuclease digest of the free duplex DNA, driving the DNA–protein complex dissociation. (c) Kinetic FAM fluorescence emission curves in the absence of protein (black squares), presence of 130 nM vitamin D3 receptor (red circles), 130 nM ERα (green up triangles), and 260 nM ERα (blue down triangles). The concentration of digestion enzyme Exo III is 10 U/mL. (d) Kinetic FAM fluorescence emission curves for Vit EREmt in the presence (red circles) and absence (black squares) of 130 nM ERα. The concentration of digestion enzyme Exo III is 10 U/mL. (e) Kinetic FAM fluorescence emission curves of Vit ERE in the presence (red circles) and absence (black squares) of 100× competing Vit ERE without fluorophore labeling, containing 130 nM ERα. The concentration of digestion enzyme Exo III is 20 U/mL. Inset: fluorescence recovery ratio at 1000 s after adding Exo III.

