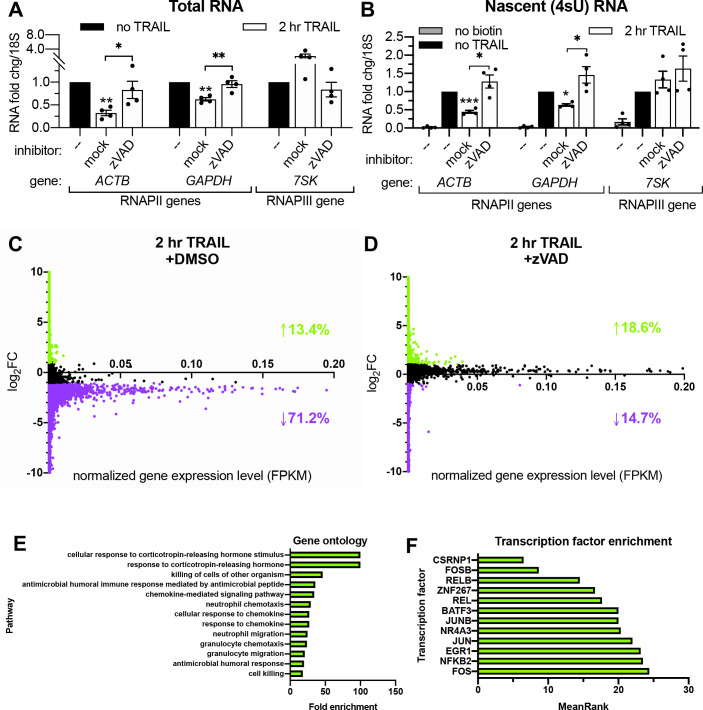
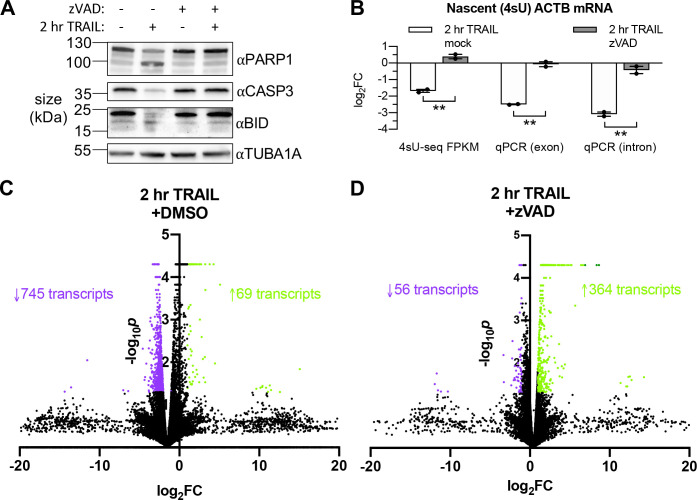
Figure 2. RNAPII transcription is globally repressed during early apoptosis.
(A, B) RT-qPCR measurements of total (A) and nascent 4sU-labeled (B) RNA fold changes after 2 hr TRAIL treatment of HCT116 cells, including a 1 hr pre-treatment with either 40 μM zVAD or an equal volume of DMSO (‘mock’). Also see Figure 2—figure supplement 1A. RNA fold change values were calculated in reference to 18S rRNA. Bar graphs display mean ± SEM with individual biological replicates (n = 4) represented as dots. Statistically significant deviation from a null hypothesis of 1 was determined using one sample t test and indicated with asterisks directly above bars, while student’s t tests were performed to compare mean fold change values for mock inhibitor or scramble treated cells to those treated with inhibitor or a targeting siRNA and indicated with brackets. *p<0.05, **p<0.00.1, ***p<0.001. (C, D) rRNA-depleted cDNA sequencing libraries were reverse transcribed from 4sU-labeled RNA isolated from cells under the conditions described in (A, B). Transcripts that aligned to genes in the human genome are graphed with differential log2 fold change expression values (log2FC) on the y axis and fragments per kilobase per million reads (FKPM) expression values (normalized to ERCC spike-in controls) on the x axis. All values were averaged from two biological replicates. Data points for transcripts upregulated or downregulated by twofold or greater are colored green and purple, respectively. Percentages of transcripts in each expression class are indicated with an arrow and in their corresponding colors. Also see Figure 2—figure supplement 1C–D and Figure 2—source data 1A–B. (E) Top statistically significant hits from gene ontology analysis performed for the list of transcripts that were upregulated upon TRAIL treatment with DMSO in a statistically significant manner across biological duplicates. Also see Figure 2—source data 1C. (F) Top hits from transcription factor (TF) enrichment analysis for the same list of genes as above. The lower the MeanRank value, the more statistically significant enrichment for genes regulated by the indicated TF. Also see Figure 2—source data 1D.


