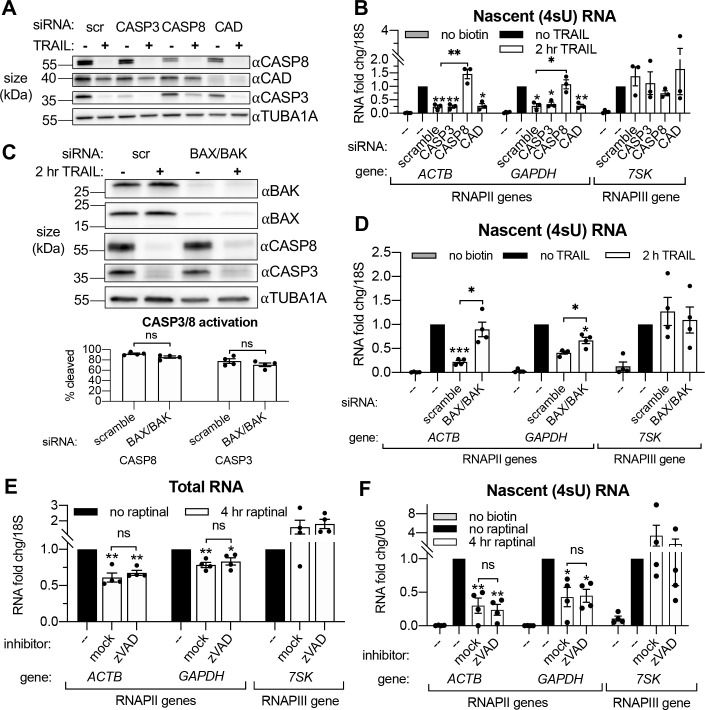
Figure 3. Transcriptional repression during early apoptosis requires MOMP, but not necessarily caspase activity.
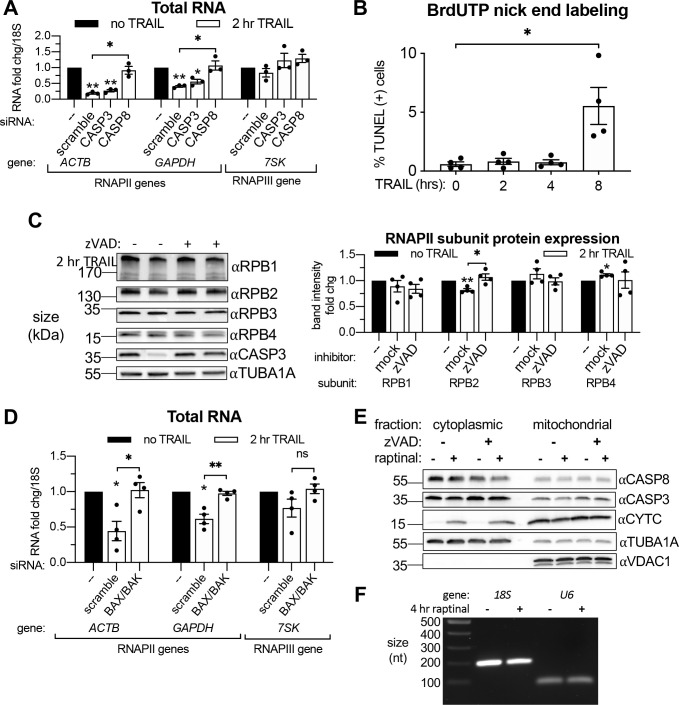
(A) Western blots showing the efficacy of CASP3, CASP8, and caspase-activated DNase (CAD) protein depletion following nucleofection with the indicated siRNAs, with or without 2 hr TRAIL treatment. α-Tubulin (TUBA1A) serves as a loading control. Blot representative of those from four biological replicates. (B) RT-qPCR measurements of 4sU-labeled nascent transcripts with or without 2 hr TRAIL treatment in cells nucleofected with the indicated the siRNAs (n = 3). Also see Figure 3—figure supplement 1A–C. (C) Western blot detecting the indicated proteins in cells nucleofected with the indicated siRNA in the presence or absence of TRAIL. TUBA1A serves as a loading control. Blot representative of four biological replicates. The cleavage of CASP3 and CASP8 (as measured by the disappearance of the full-length form of each zymogen upon 2 hr TRAIL treatment, normalized to TUBA1A) is graphed below (n = 4). (D) 4sU-labeled RNA levels measured by RT-qPCR in HCT116 cells nucleofected with the indicated siRNAs, with or without 2 hr TRAIL treatment (n = 4). Also see Figure 3—figure supplement 1D. (E, F) Total (E) and 4sU-labeled (F) RNA levels measured by RT-qPCR in HeLa cells after 10 μM raptinal treatment for 4 hr, with or without a 1 hr pre-treatment of 20 μM zVAD (n = 4). Also see Figure 2—figure supplement 1E. Fold changes were calculated in reference to the U6 small nuclear RNA (snRNA) transcript since its production was more stable after 4 hr raptinal than that of 18S rRNA (see Figure 2—figure supplement 1F). All RNA fold changes were calculated from Ct values normalized to 18S or U6 RNA, then normalized to non-apoptotic cells (‘no TRAIL’) under otherwise identical conditions. Graphs display mean ± SEM with individual biological replicates represented as dots. Statistically significant deviation from a null hypothesis of 1 was determined using one sample t test and indicated with asterisks directly above bars, while student’s t tests were performed to compare mean fold change values for mock inhibitor or scramble treated cells to those treated with zVAD or a targeting siRNA and indicated with brackets. The Holm-Sidak correction for multiple comparisons was applied in the student’s t tests represented in (A, B) *p<0.05, **p<0.00.1, ***p<0.001.


