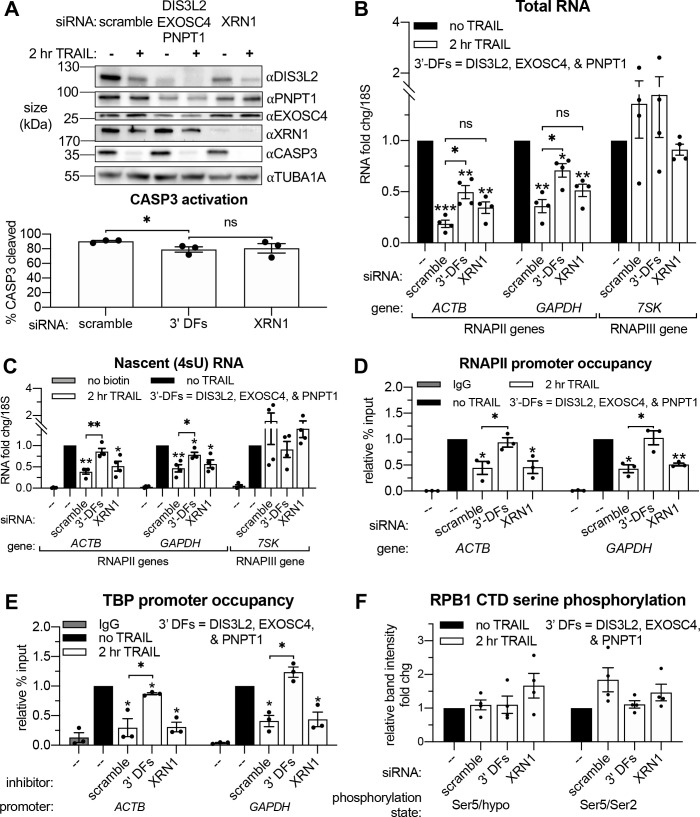
Figure 4. Apoptosis causes reduced RNAPII transcriptional output and promoter occupancy in an mRNA decay-dependent manner.
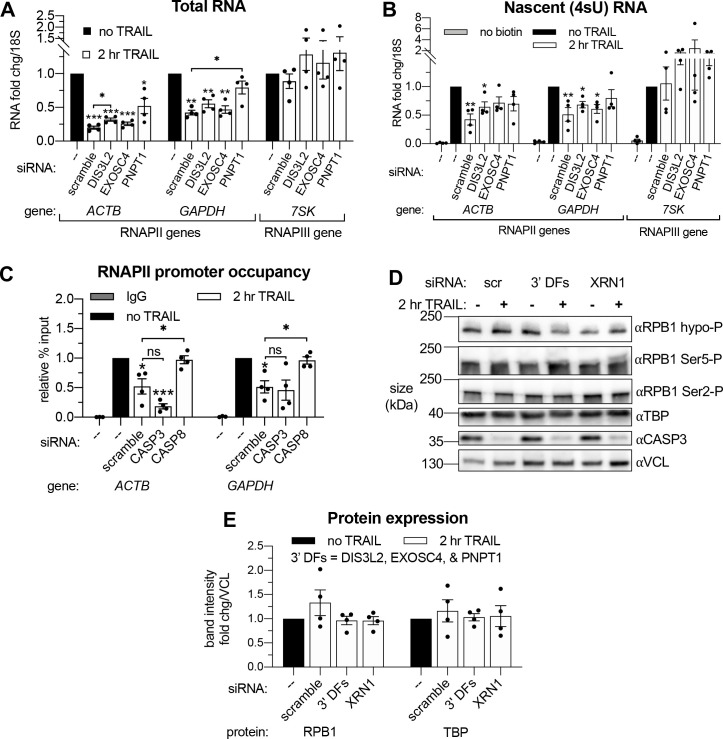
(A) Western blots performed with lysates from HCT116 cells depleted of the indicated decay factors with and without 2 hr TRAIL treatment. Blot representative of three biological replicates. Apoptosis induction was confirmed by disappearance of the full-length CASP3 band, quantified in the graph below by measuring band intensity normalized to an α-tubulin (TUBA1A) loading control (n = 3). (B, C) Changes in total (B) and nascent 4sU-labeled (C) RNA upon 2 hr TRAIL treatment in cells nucleofected with the indicated siRNAs were quantified by RT-qPCR (n = 4). Fold changes were calculated from Ct values normalized to 18S rRNA. Also see Figure 4—figure supplement 1A–B. (D, E) Chromatin immunoprecipitation (ChIP)-qPCR was used to measure occupancy of the indicated promoters by hypophosphorylated RNAPII (D) or TBP (E) under cellular conditions described in (A). Rabbit and mouse IgG antibodies were included in parallel immunoprecipitation reactions with chromatin from scramble siRNA-treated non-apoptotic cells in lieu of TBP and RNAPII antibodies, respectively, as a control. Also see Figure 4—figure supplement 1D–E. (F) Relative band intensity ratios from four replicates of the representative western blots depicted in Figure 4—figure supplement 1D, using primary antibodies specific to the indicated RPB1 CTD phosphorylation state under cellular conditions described in (A). Band intensity values were first normalized to a vinculin (VCL) loading control in each blot. All bar graphs display mean ± SEM with individual biological replicates represented as dots. Statistically significant deviation from a null hypothesis of 1 was determined using one sample t test and indicated with asterisks directly above bars, while student’s t tests with the Holm-Sidak correction for multiple comparisons were performed to compare mean values between groups indicated with brackets. *p<0.05, **p<0.00.1, ***p<0.001.


