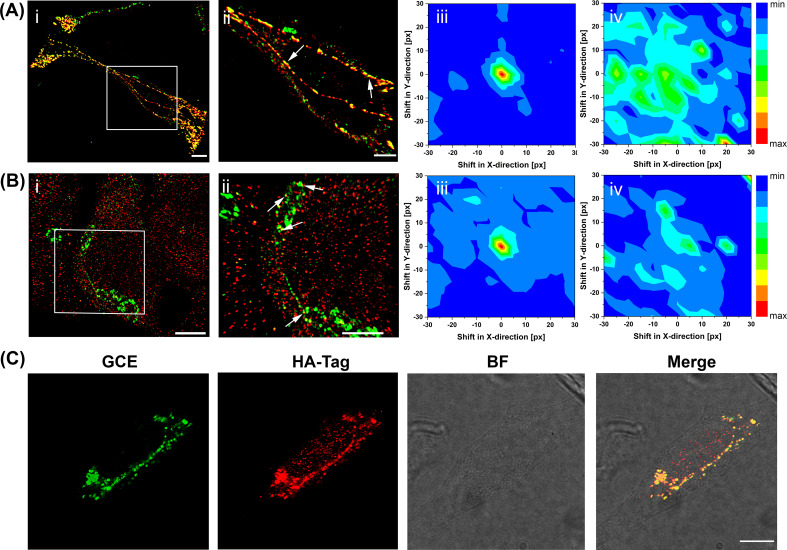
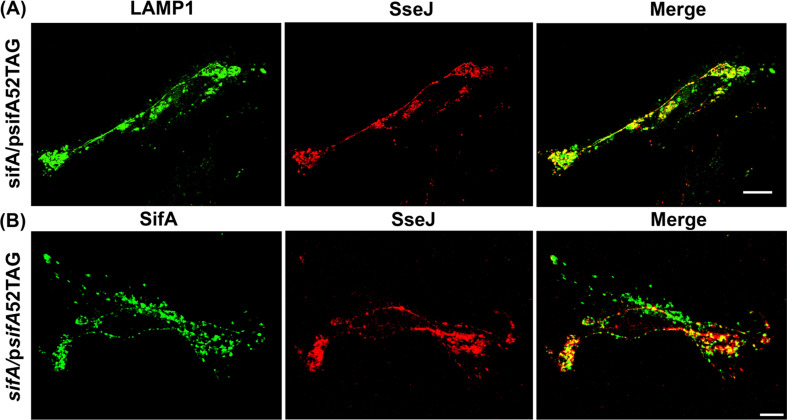
Figure 4. Super-resolution imaging of GCE-labeled SifA.
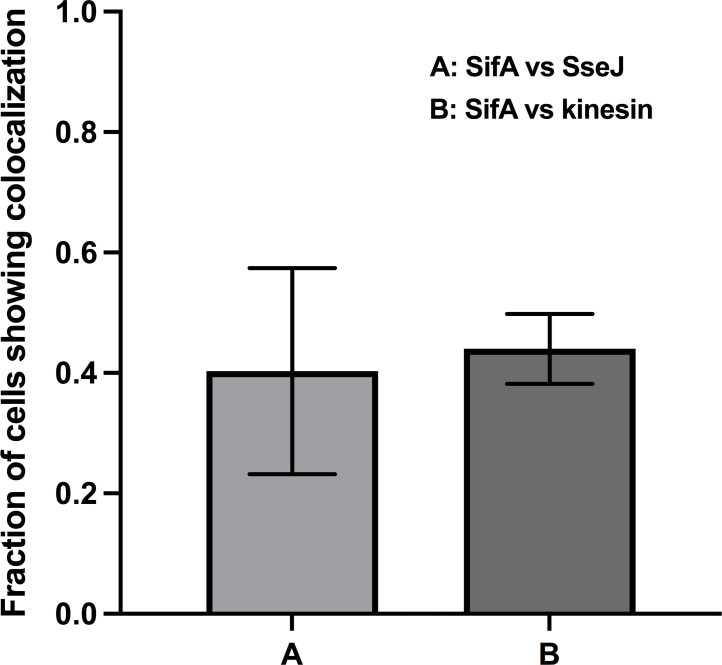
(Ai) SifA colocalizes with SseJ. Spinning-disk SIM image of an infected HeLa cell, 16 hr after invasion, fixed with PFA and stained for SifA (green) and SseJ-HA (red). (Aii) Magnified view of SifA and SseJ in the boxed region at the far left (arrows indicate colocalization). (iii) Colocalization was analyzed by calculating Mander’s M1 coefficient (SifA colocalizing with SseJ) for the original dual-color image (x = y = 0) and for control images generated by translating the spectral channels with respect to each other in x and y directions. This analysis generated a colocalization map, with a peak intensity at x = y = 0, indicating true colocalization (n = 3 cells). (iv) Colocalization analysis of mock-infected cells (n = 3 cells) stained for SifA-E52AzF and SseJ-HA showed no peak intensity at x = y = 0, indicating no colocalization of anti-HA antibodies and SifA. Bars, 10 µm (i), 5 µm (ii). (B) SifA colocalizes with kinesin. (i) Spinning-disk SIM image of an infected HeLa cell fixed with PFA at 16 hr post-infection and stained for kinesin (red) and SifA (green). (ii) Magnified view of SifA and kinesin in the boxed region (arrows indicate colocalization). (iii and iv) Colocalization analysis was performed as described in (A). The same color map scaling was used for comparison. px, pixels. See Figure 4—figure supplement 1 for statistical analysis. Scale bar, 5 µm (i), 2 µm (ii). (C) Bioorthogonal fluorescence imaging of SseJ-Y10TCO-HA with tetrazine fluorophores versus immunofluorescence staining. HeLa cells expressing SseJ-Y10TCO-HA in the presence of TCO*Lys were labeled with BDP-Tz under physiological conditions, briefly washed, and subjected to anti-HA immunofluorescence staining. Images were acquired by confocal microscopy. The data are representative of at least three independent experiments. Scale bar, 10 µm.


