. 2021 May 26;10:e61461. doi: 10.7554/eLife.61461

Figure 2. Phenotypic plasticity maintains EpCAMlo and EpCAMhi cells in a stochastic equilibrium.

(A) Analysis of plasticity of EpCAMhi and EpCAMlo cells from HCT116 (upper panel) and SW480 (lower panel). EpCAMhi and EpCAMlo cell fractions were sorted and plated in culture. At different time points, as indicated, cells were reanalyzed by flow cytometry for their levels of CD44 (y-axis) and EpCAM (x-axis) expression. (B) Flow cytometric analysis of single CD44hiEpCAMhi and CD44hiEpCAMlo HCT116 cells sorted by FACS and cultured for 72 days. Three representative individual single-cell clones per cell fraction are shown. (C) Dynamics of the EpCAMhi and EpCAMlo subpopulations from the HCT and SW480 cell lines as measured by FACS (% of total) over time. Under each graph, a schematic shows the estimated transition probabilities from the fitted two-state Markov model.

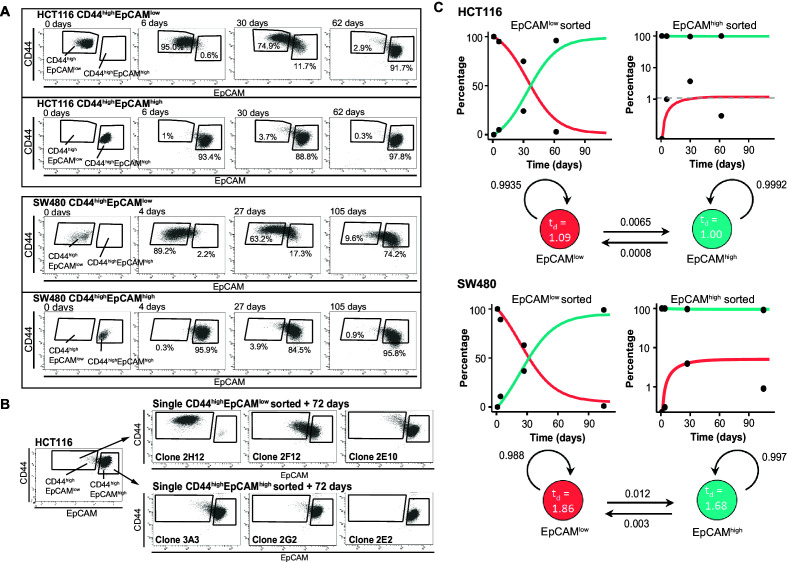
Figure 2—source data 1. Phenotypic plasticity maintains EpCAMlo and EpCAMhi cells in a stochastic equilibrium: clonal analysis.
The table encompasses a selection of individual single-cell sorted EpCAMhi and EpCAMlo HCT116 and SW480 clones. Single cells were sorted, grown up, and analyzed at two indicated times points by flow cytometry for their CD44 and EpCAM expression. Percentage of cells present in the set EpCAMhi and EpCAMlo gates is presented in the bar graph. Total success rate of clones grown out of single cells: HCT116 EpCAMhi 15 clones out of 24 sorted cells, HCT116 EpCAMlo: 31/48; SW480 EpCAMhi: 5/36; SW480 EpCAMlo: 11/36.

Figure 2.

Figure 2—figure supplement 1. Further characterization of phenotypic plasticity in EpCAMlo and EpCAMhi cells.

Figure 2—figure supplement 1.

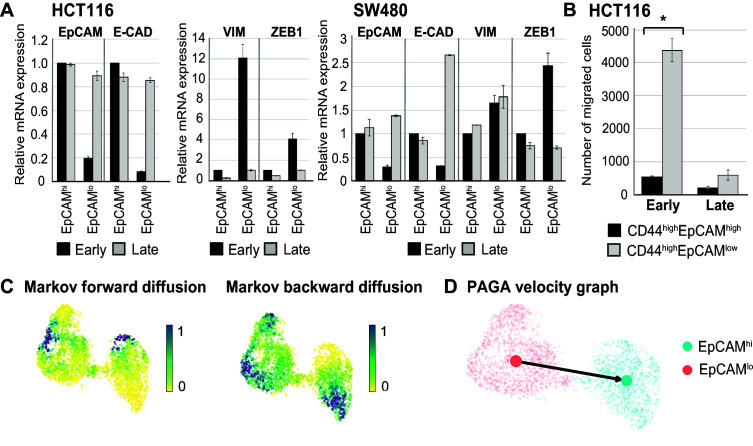
(A) RT-qPCR expression analysis of EPCAM, CDH1, VIM, and ZEB1 in ‘early’ (e.g., cells that were used shortly after FACS sorting) and ‘late’ (e.g., cells that were cultured for an extended period of time before performing the experiment) sorted EpCAMhi and EpCAMlo cell from HCT116 and SW480 cell lines. GAPDH was employed for normalization purposes. Each bar represents the mean ± SD of two independent experiments. (B) Transwell migration assay of ‘early’ and ‘late’ EpCAMhi (black bar) and EpCAMlo (gray bar) cultures in HCT116. 105 cells were plated in triplicate on TC-coated membrane and left overnight before counting the number of migrated cells on the bottom side of the membrane. Each bar represents the mean ± SD of two independent experiments. Asterisks indicate significant differences (p<0.05). (C) Analysis of the HCT116 scRNAseq data as a Markov diffusion process. Markov forward (left) and backward (right) diffusion indicating the presence of sink and source points in both EpCAMhi and EpCAMlo populations. (D) Partition-based graph abstraction velocity graph mapping out the direction of velocity on a subpopulation level in HCT116.
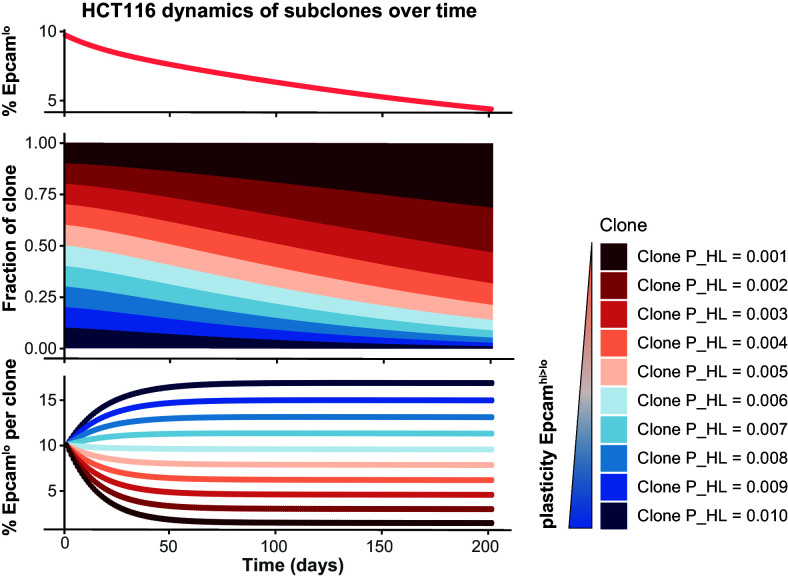
Figure 2—figure supplement 2. Simulation of the HCT116 two-state Markov model with a non-homogenous starting population.

Figure 2—figure supplement 2.

The starting population was defined as 10 subclones with varying transition probability P_HL at equal proportion. The Markov model was run till day 200 and shows that the total EpCAMlo population decreases over time (top panel) because clones with lower plasticity will gain dominance in the long run (lower panels).