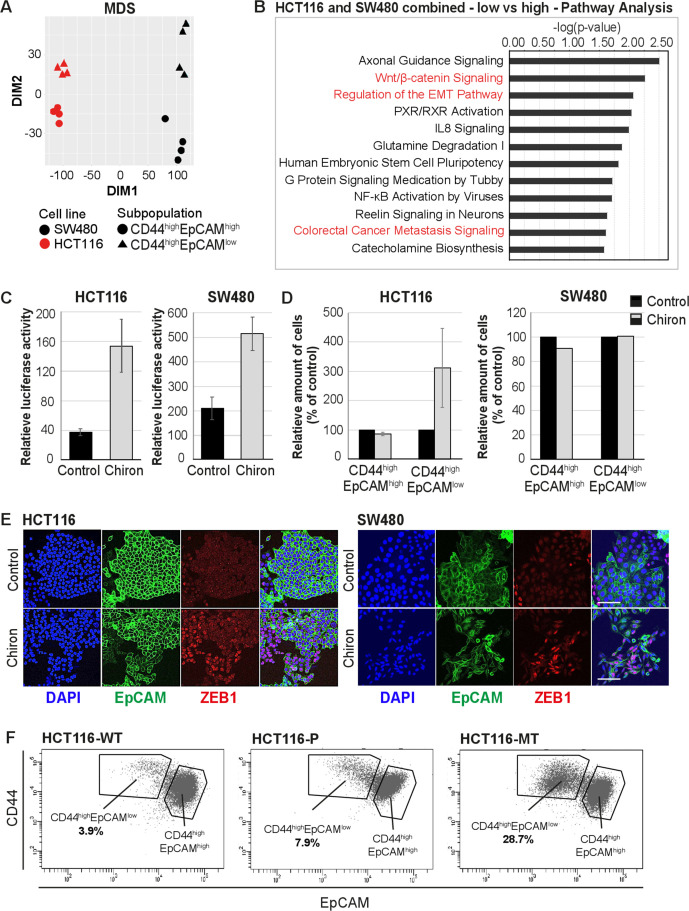
Figure 3. RNAseq analysis reveals enhanced Wnt signaling in EpCAMlo cells.
(A) Multidimensional scaling analysis of RNAseq profiles of EpCAMhi and EpCAMlo cells from the HCT116 and SW480 lines. Red: HCT116, black: SW480, circle: EpCAMhi, triangle: EpCAMlo. (B) Ingenuity Pathway Analysis (IPA) of the HCT116 and SW480 expression profiles from the multicell line analysis (p adjusted value <0.01; log2 fold change <–1.5 and >1.5). Red marked pathways highlight the enhanced involvement of pathways involved in epithelial to mesenchymal transition, Wnt signaling, and the formation of colon cancer metastasis in the EpCAMlo subpopulation compared to EpCAMhi cells. (C) TOP-Flash luciferase reporter analysis of Wnt signaling activity in colon cancer cell lines HCT116 and SW480 upon treatment with 4 µM Chiron for 3 days. Each bar represents the mean ± SD of two independent experiments. (D) Flow cytometric analysis using antibodies directed against CD44 and EpCAM of control and 4 µM Chiron—figure supplemented HCT116 (A) and SW480 (B) cultures. Graphs show percentage of cells within the CD44hiEpCAMhi and CD44hiEpCAMlo gates relative to the control. Each bar represents the mean ± SD of two independent experiments. (E) Immunofluorescence analysis of control and Chiron-treated HCT116 (left panel) and SW480 (right panel) cells. After 3 days of treatment, cells were fixed with 4% paraformaldehyde and stained with antibodies against EpCAM (green) and ZEB1 (red). Nuclei were visualized by DAPI staining of DNA (blue). Scale bar: 100 µm. (F) Flow cytometric analysis of three HCT116 cell lines with differential β-catenin mutation status, a parental HCT116 (HCT116-P) cell line harboring one WT and one mutant allele (Ser45 del), and two HCT116-WT and HCT116-MT cell lines harboring one WT or one mutant allele, respectively, generated by disruption of the other allele in the parental cell line (Kim et al., 2019).


