. 2021 May 26;10:e61461. doi: 10.7554/eLife.61461

Figure 4. EpCAMlo gene expression profiles correlate with CMS4 colon cancer patients with shorter disease-free and overall survival.

(A) Correlation of meta-gene expression values of the signatures derived from EpCAMlo HCT116 and SW480 cells in the consensus molecular subtype (CMS)3232 human colon cancer cohort (Guinney et al., 2015). (B) Correlation of meta-gene expression values of the signatures derived from EpCAMlo HCT116 and SW480 cells with expression of CMS classifier genes positively identifying each of the four molecular subtypes. (C) Kaplan– Meier analysis. The gene sets identifying the EpCAMlo cells from both HCT116 and SW480 cell lines were used to cluster the tumors in the CMS3232 cohort into high (purple), intermediate (blue), and low (yellow) expression groups by k-means clustering. The Kaplan–Meier method was subsequently used to assess significant differences in relapse-free (left panels) and overall (right panels) survival between the generated subgroups.

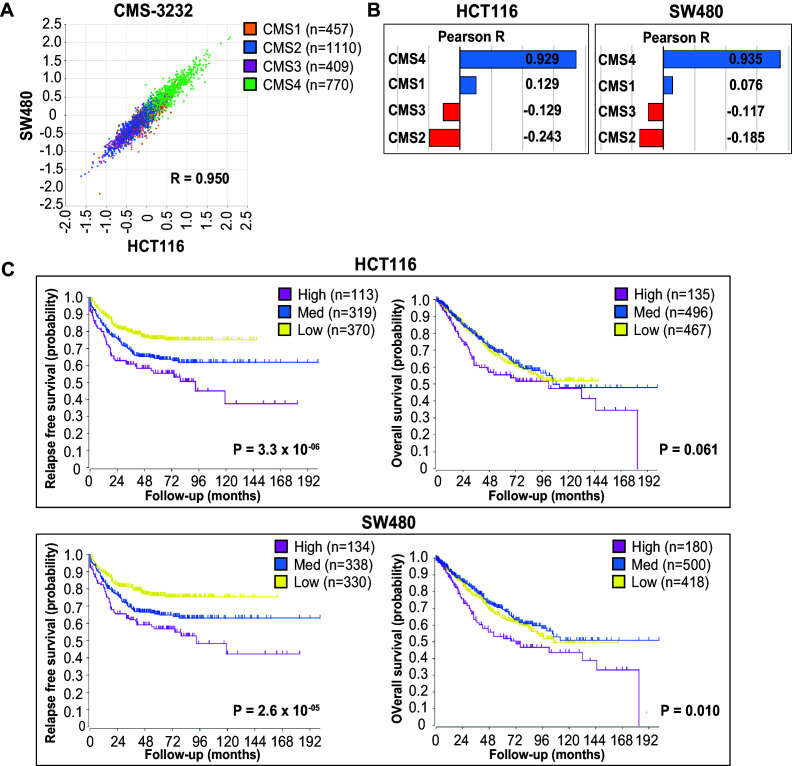
Figure 4.

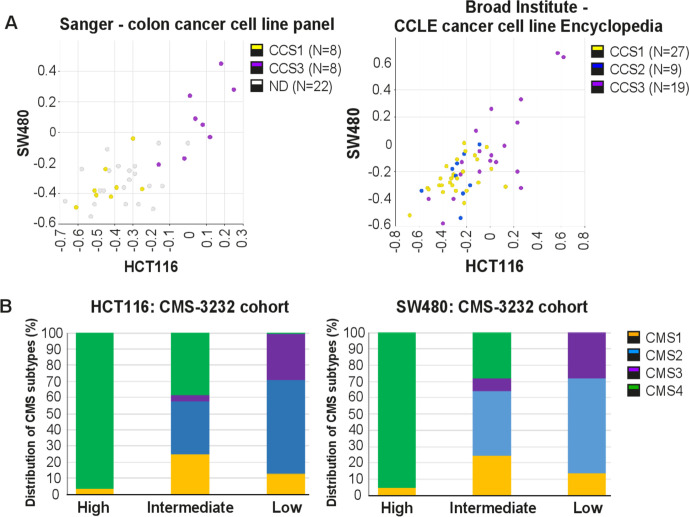
Figure 4—figure supplement 1. EpCAMlo expression signatures correlate with CCS3 cell lines and CMS4 colon cancer patients.

Figure 4—figure supplement 1.

(A) Correlation of meta-gene expression values of the signatures derived from EpCAMlo HCT116 and SW480 cells in two cohorts of colon cancer cell lines in the absence of a stromal component. CCS1: epithelial-like tumor lines; CCS2: tumor lines with microsatellite instability. CCS3: mesenchymal-like tumor cell lines (De Sousa et al., 2013). (B) The gene sets identifying the EpCAMlo cells from both HCT116 and SW480 were used to cluster the tumors in the consensus molecularsubtype (CMS)3232 cohort into high, intermediate, and low expression groups by k-means clustering. All tumors in this cohort had previously been assigned to specific CMS subgroups, and then analyzed the contribution of each CMS subtype to each of the generated high, intermediate, and low expression subgroups.