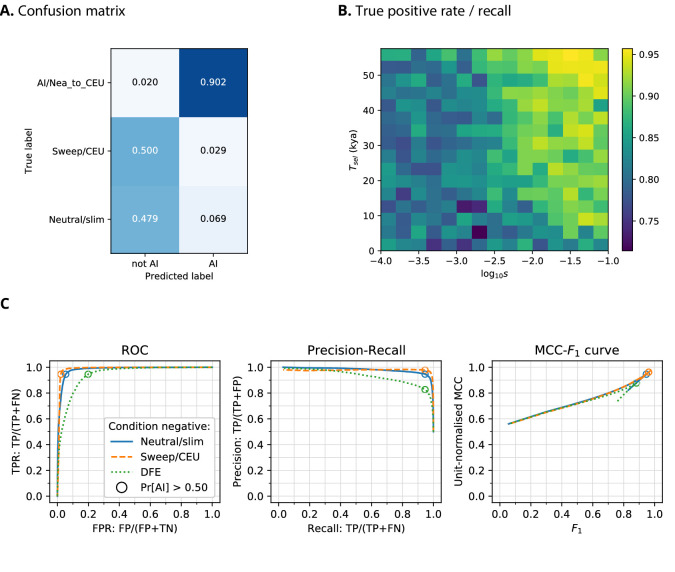
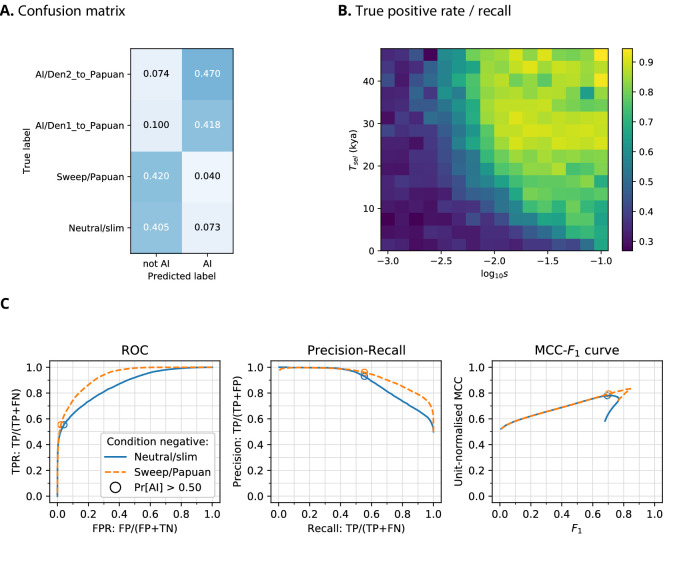
Figure 2. CNN performance on validation simulations for Demographic Model A.
The CNN was trained using only AI simulations with selected mutation having allele frequency >0.25. (A) Confusion matrix. For the two prediction categories, either 'not AI' or AI, we show the proportion attributed to each of the true (simulated) scenarios. (B) Average CNN prediction for AI scenarios, binned by selection coefficient, , and time of onset of selection . (C) ROC curves, precision-recall curves and MCC-F1 curves. The positive condition is AI. The negative conditions are shown using different line styles/colours. The circles indicate the point in ROC-space (respectively Precision-Recall-space, and MCC-F1-space) when using the threshold Pr[AI]>0.5 for classifying a genotype matrix as AI. DFE: distribution of fitness effects. TP: true positives; FP: false positives; TN: true negatives; FN: false negatives; TPR: true positive rate; FPR: false positive rate; ROC: Receiver operating characteristics; MCC: Mathews correlation coefficient; F1: harmonic mean of precision and recall.


