. 2021 May 25;10:e64669. doi: 10.7554/eLife.64669

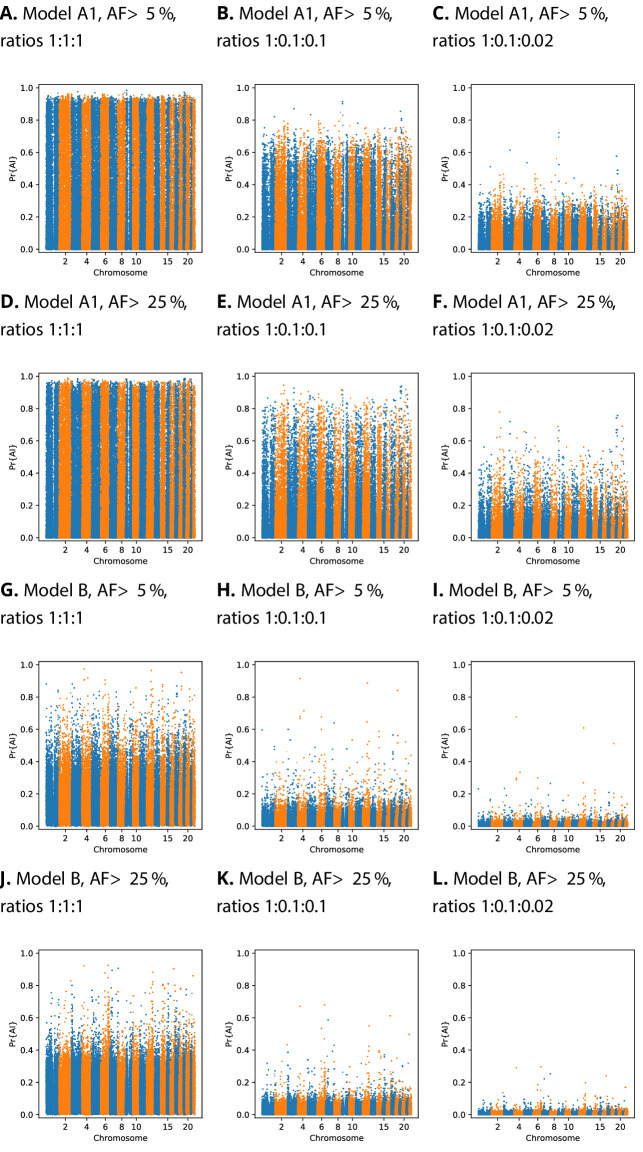
Figure 4. Comparison of Manhattan plots using beta-calibrated output probabilities for different class ratios.

Each row indicates a single CNN, with equivalent data filtering. Each column indicates different class ratios used for calibration (Neutral:Sweep:AI). AF = Minimum beneficial allele frequency.

Figure 4.

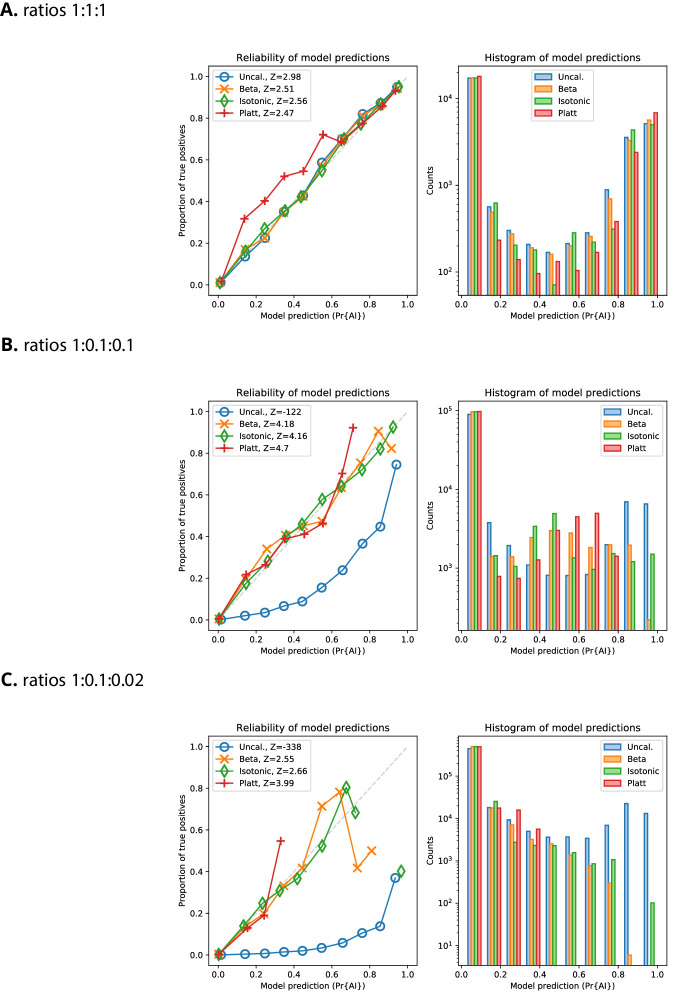
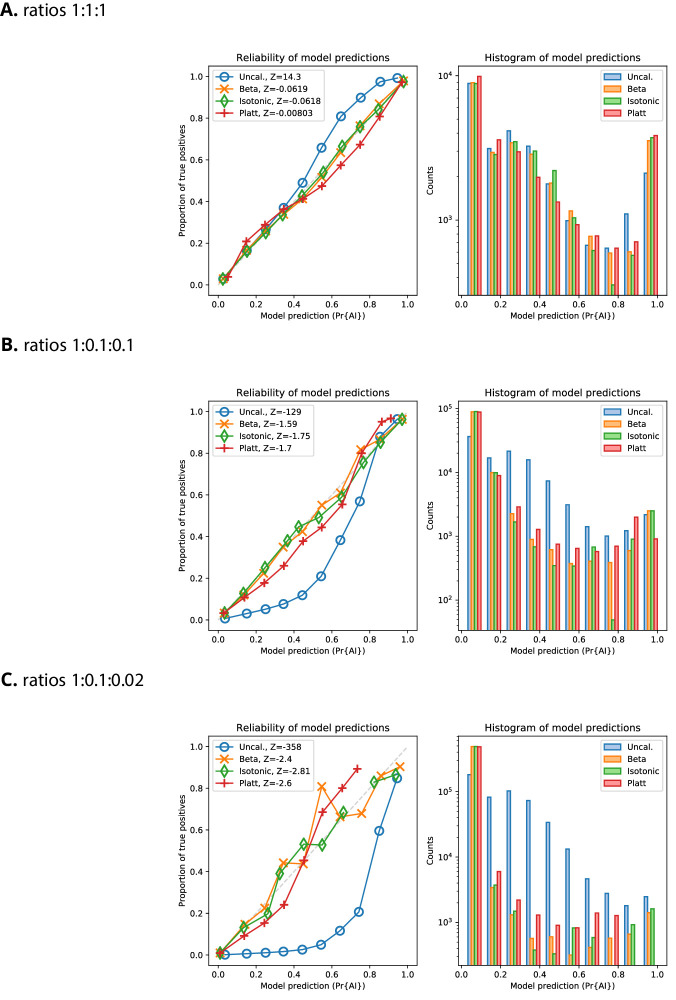
Figure 4—figure supplement 1. Reliability plots for Demographic Model A1 with AF > 5%.

Figure 4—figure supplement 1.

Reliability of probabilities produced by the CNN, for the validation dataset, with and without calibration, for Demographic Model A1 with a minimum beneficial allele frequency of 5%. The variance-normalised sum of residuals is inset in the upper left corner of each of the reliability plots (Z), which for well-calibrated predictions is approximately normally distributed (Turner et al., 2019).
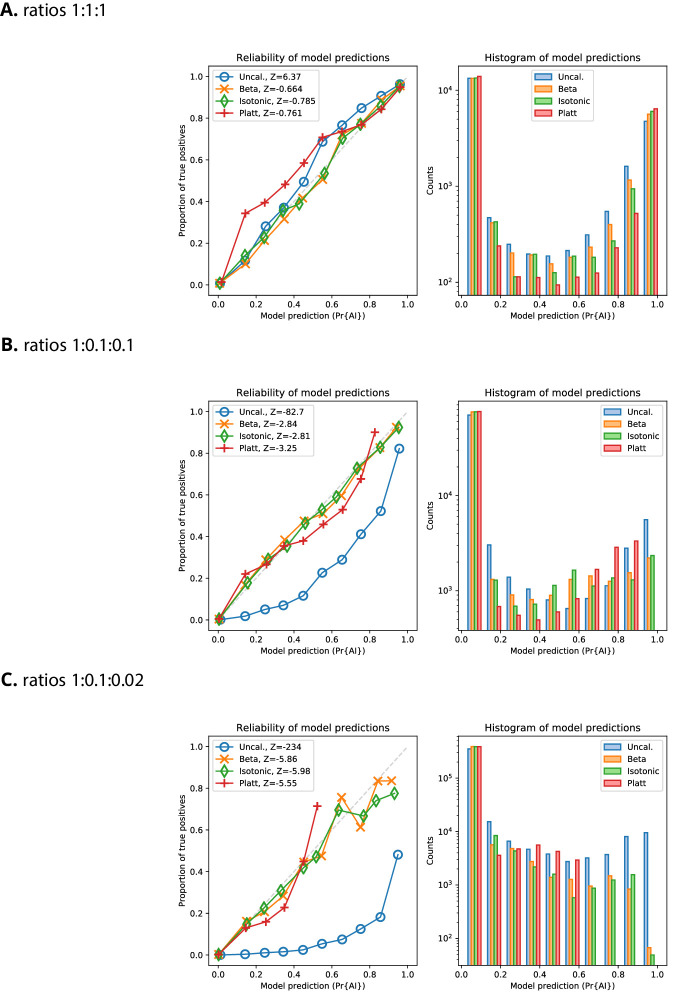
Figure 4—figure supplement 2. Reliability plots for Demographic Model A1 with AF > 25%.

Figure 4—figure supplement 2.

Reliability of probabilities produced by the CNN, for the validation dataset, with and without calibration, for Demographic Model A1 with a minimum beneficial allele frequency of 25%. The variance-normalised sum of residuals is inset in the upper left corner of each of the reliability plots (Z), which for well-calibrated predictions is approximately normally distributed (Turner et al., 2019).
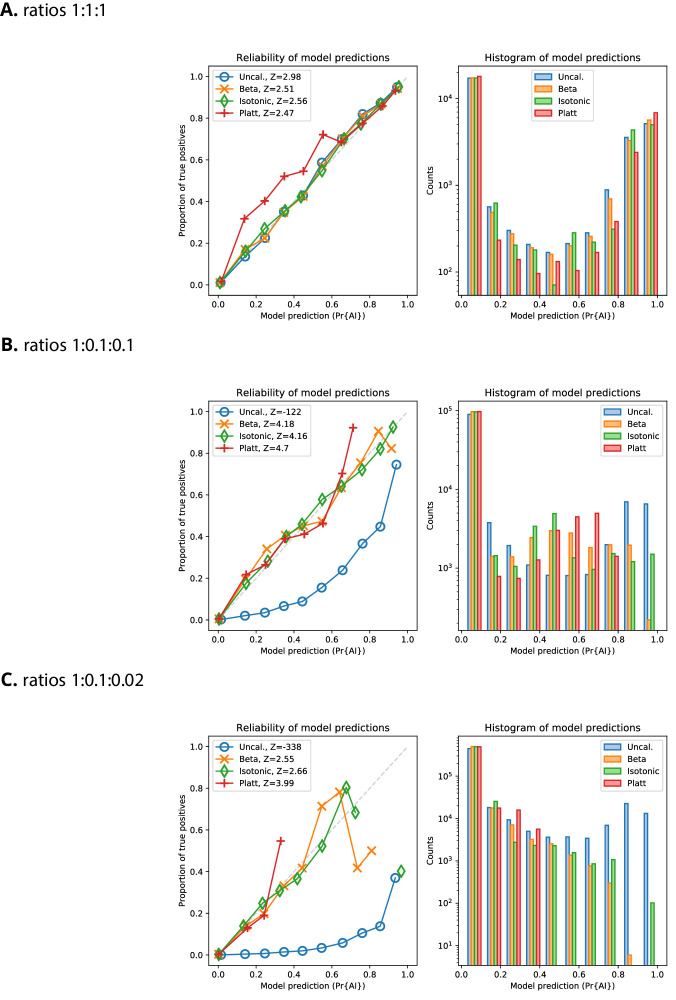
Figure 4—figure supplement 3. Reliability plots for Demographic Model B with AF > 5%.

Figure 4—figure supplement 3.

Reliability of probabilities produced by the CNN, for the validation dataset, with and without calibration, for Demographic Model B with a minimum beneficial allele frequency of 5%. The variance-normalised sum of residuals is inset in the upper left corner of each of the reliability plots (Z), which for well-calibrated predictions is approximately normally distributed (Turner et al., 2019).
Figure 4—figure supplement 4. Reliability plots for Demographic Model B with AF > 25%.

Figure 4—figure supplement 4.

Reliability of probabilities produced by the CNN, for the validation dataset, with and without calibration, for Demographic Model B with a minimum beneficial allele frequency of 25%. The variance-normalised sum of residuals is inset in the upper left corner of each of the reliability plots (Z), which for well-calibrated predictions is approximately normally distributed (Turner et al., 2019).