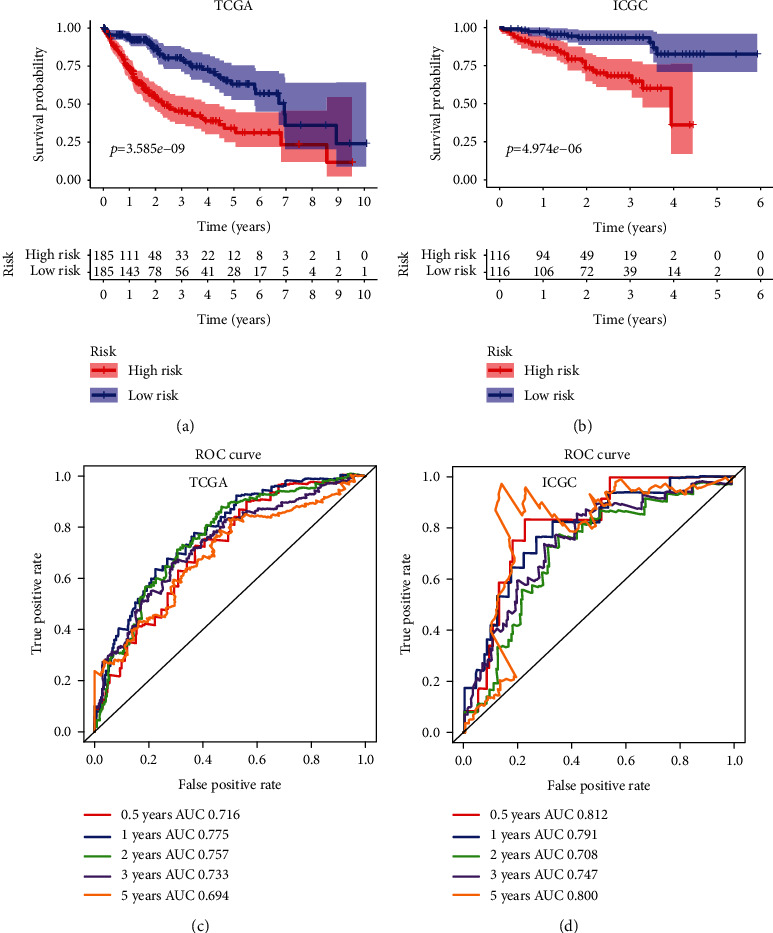
Figure 3.

Survival analysis with the three-gene signature in the training and validation datasets. (a and b) Kaplan-Meier overall survival analysis of HCC patients in the TCGA (a) and ICGC (b) datasets assigned to high-and low-risk groups based on the risk score. Patients with a higher risk score exhibited poorer overall survival in the training and validation cohorts. (c and d) ROC curves showed the predictive efficiency of the risk signature for HCC patients in the TCGA (c) and ICGC (d) datasets on the survival rate.
