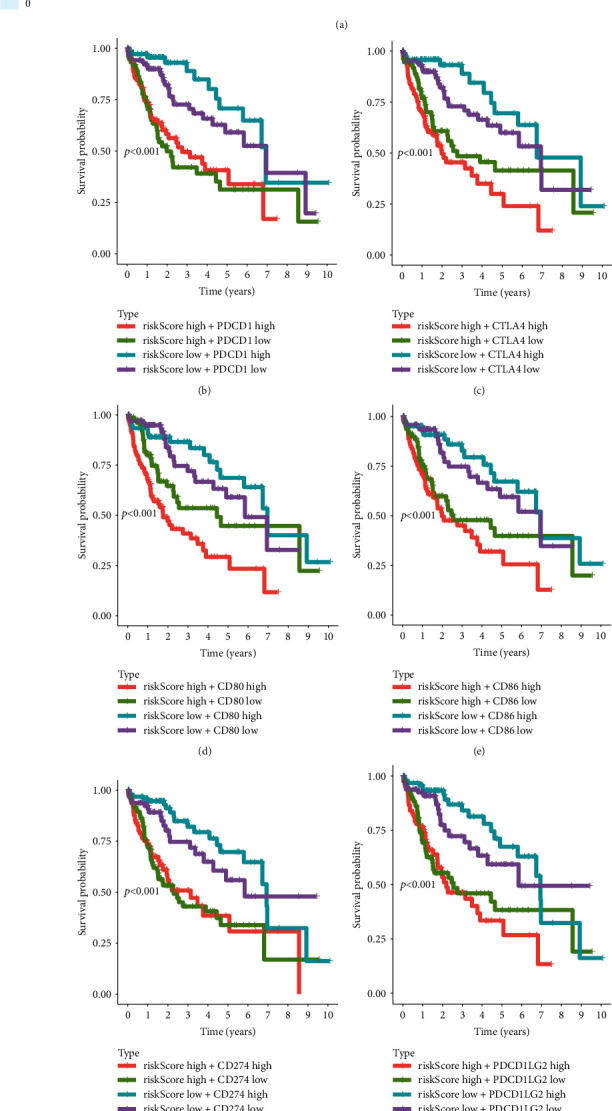
Figure 6.

Survival analysis of HCC patients based on the risk score and several immune checkpoint molecules. (a) Correlation analysis between risk score and several key immune-related molecules. (b–i) Two-factor survival analyses of risk score and immune checkpoint molecules including PDCD1 (b), CTLA4 (c), CD80 (d), CD86 (e), CD274 (f), PDCD1LG2 (g), CD276 (h), and VTCN1 (i).
