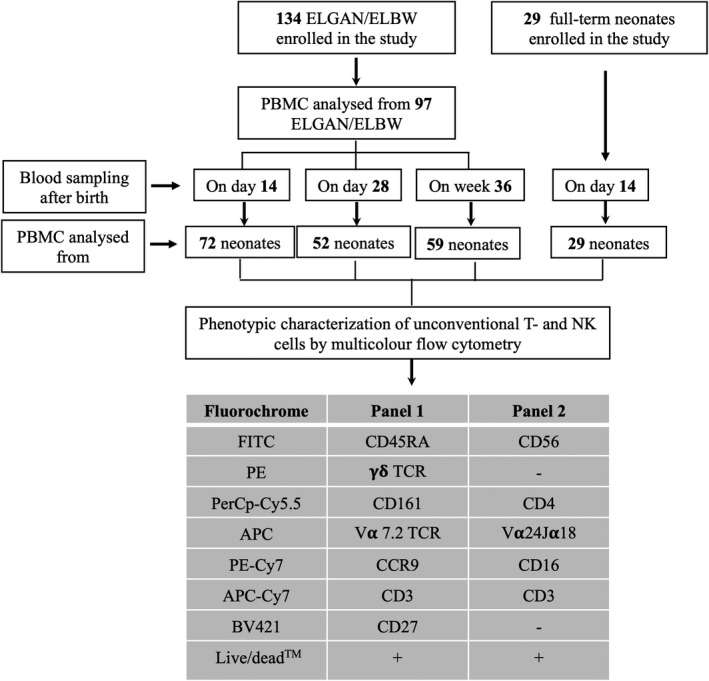
Figure 1.

Flow chart of the number of subjects recruited, time points for blood sampling, number of PBMC samples analysed by flow cytometry and the antibody panels used for the experiments to characterise NK, NKT γδ T and MAIT cells. The final number of PBMC samples analysed for each parameter were dependent on cell numbers and viability, as indicated in each of the subsequent figures.
