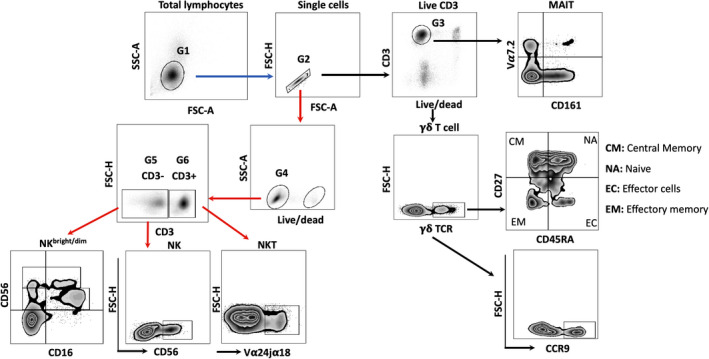
Figure 2.

Schematic presentation of the gating strategies used for the identification and characterisations of the NK cells and unconventional T cells and subsets. NK/NKT cells and γδ T‐/MAIT cells were analysed in two different panels as indicated in the flow chart with red and black arrows, respectively. Lymphocytes (G1) were gated based on their physical properties as side scatter (SSC) and forward scatter (FSC) followed by gating on single cells (G2). From G2 gate, cells were either divided as live CD3+ cells (G3) (black arrow) or as live lymphocytes (G4) (red arrow), which were further gated on the basis of the cell population‐specific markers as pan γδ TCR+ cells (γδ T cells) and CD161+Vα7.2+ cells (MAIT cells) (black arrows) or as CD3+ Vα24jα18+ cells (NKT cells) and CD3‐CD56+ cells (total NK cells)/CD56+CD16+(NKbright/dim) (red arrows), respectively. γδ T cells were further analysed for either the subpopulations (CM, NA, EC and EM) or the expression of the molecule as CCR9.
