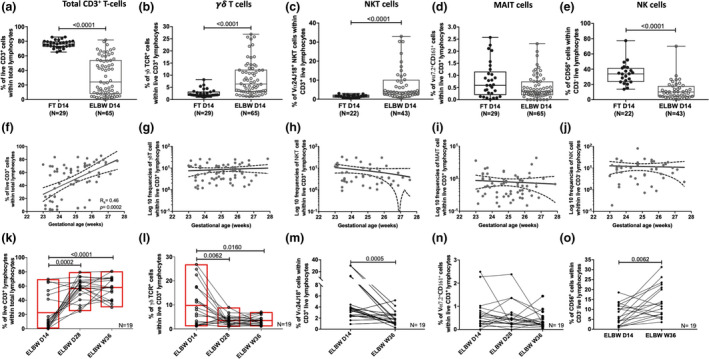
Figure 3.

Peripheral γδ T‐, NKT‐cell and NK cell frequencies are altered by extreme prematurity. Frequencies of (a) CD3+, (b) γδ TCR+, (c) NKT, (d) MAIT, and (e) NK cells among live lymphocytes in 14‐day‐old ELGAN/ELBW and FT infants are shown. The correlations between gestational age at birth and the percentages of (f) CD3+, (g) γδ T, (h) NKT, (i) MAIT and (j) NK cells at 14 days of life are shown for the ELGAN/ELBW. The postnatal development of these populations is shown as proportions of (k) CD3+, (l) γδ T, (m) NKT, (n) MAIT and (o) NK cells in longitudinal paired samples from ELGAN/ELBW at D14, D28 and W36 (k, l, n) or D14 and W36 (m, o), respectively. The Mann–Whitney U‐test for unpaired samples and the Wilcoxon signed‐rank test for paired samples were used for group comparisons. Box and whisker plots show median as the central line and error bars represent minimum to maximum values. The line with error bars shows mean and error where the Spearman correlation test was used to analyse correlation between gestational age and the proportions of the different cell types analysed. Symbols and lines were overlaid on floating bars plotted with line at mean (k, l).
