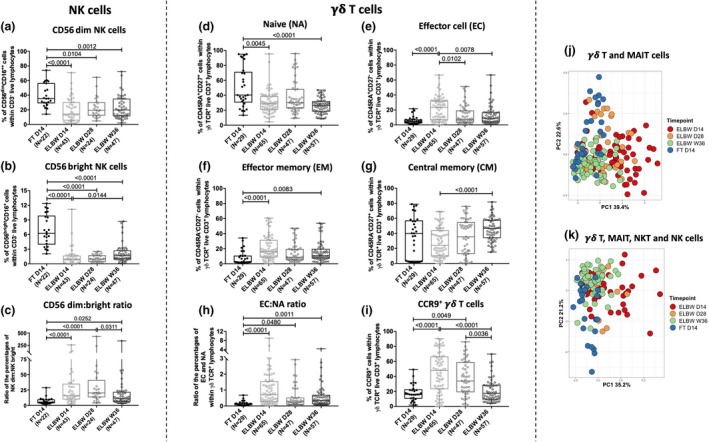
Figure 4.

Extreme prematurity alters NK cell and γδ T‐cell phenotypical characteristics. The relative frequencies of (a) CD56dim‐ and (b) CD56bright NK cells and (c) ratio between dim and bright NK cells at 14 days of age in ELGAN/ELBW and FT infants. (d–g) show the relative proportions of naïve (NA), effector (EC), effector memory (EM) and central memory (CM) γδ T cells in FT neonates and ELGAN/ELBW at the different sampling time points. The ratio of EC:NA γδ T cells is shown in (h), and the frequencies of CCR9+ γδ T cells at 14 days of age are shown in (i). The Mann–Whitney U‐test and Kruskal–Wallis test with Dunn's multiple comparison were used for group comparisons. Box and whisker plots show median as the central line and error bars represent minimum to maximum values for group comparison. PCA comparing the overall phenotypic characterisation in a longitudinal manner of MAIT and γδ T cells (j), or the maturation over time of frequencies of all four investigated cell types (k). FT neonates (blue), ELGAN/ELBW D14 (red), D28 (orange) and W36 (green).
