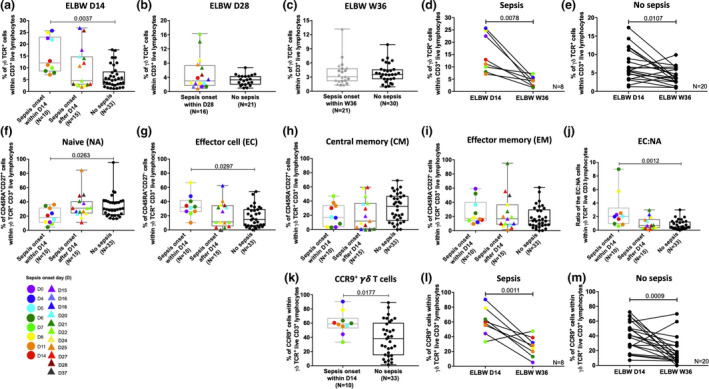
Figure 6.

Increased γδ T‐cell frequencies, a rise in effector populations and an altered homing capacity are parameters associated with sepsis onset within 14 days of life. (a–c) The frequencies of γδ T cells from ELGAN/ELBW at day 14, day 28 and week 36, respectively, in relation to time of disease onset as indicated in the figure. The proportions of γδ T cells in paired samples from day 14 and week 36 are shown for cases with (d) or without (e) sepsis. (f–i) show the proportions of γδ T‐cell naïve, effector and memory subpopulations at 14‐day‐old ELGAN/ELBW, (j) shows the ratio between EC:NA γδ T cells and (k) displays the frequencies of CCR9+ γδ T cells in relation to sepsis onset. The proportions of CCR9+ γδ T cells in paired samples from day 14 and week 36 are shown for cases with (l) or without (m) sepsis. Box and whisker plots show median as the central line and error bars represent minimum to maximum. The Mann–Whitney U‐test and Kruskal–Wallis test with Dunn's multiple comparison were used for group comparisons. The Wilcoxon signed‐rank test was used to assess differences between paired samples.
