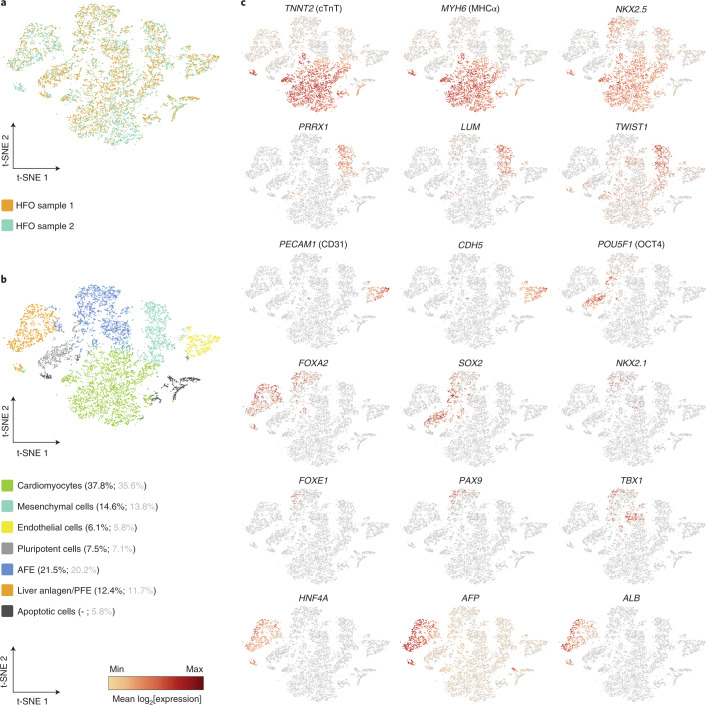
Fig. 4. scRNA-seq confirms distinct anterior–posterior endoderm patterning.
a, A t-SNE plot showing an overlay of two d13 HFO samples in different colors (HFO sample 1: 7,505 cells; HFO sample 2: 4,605 cells). b, A t-SNE plot of composite scRNA-seq data from both HFO samples colored by automated clustering. The naming of each cluster was based on the expression of key genes in these cell populations. The percentages of respective cell populations among all living cells (black) or all cells including apoptotic cells (gray) are listed in brackets behind each cluster. c, The relative expression of the indicated genes across all HFO clusters shown in the composite t-SNE plots. The dark red color equals a high level of expression of the indicated gene.

